Vizualizing with Grafana
Now that Grafana is setup to read metrics from Prometheus, let’s create a dashboard on our Kubernetes Cluster’s health.
End to End test AMP & Grafana
In the Grafana web-console, let’s head to Explore
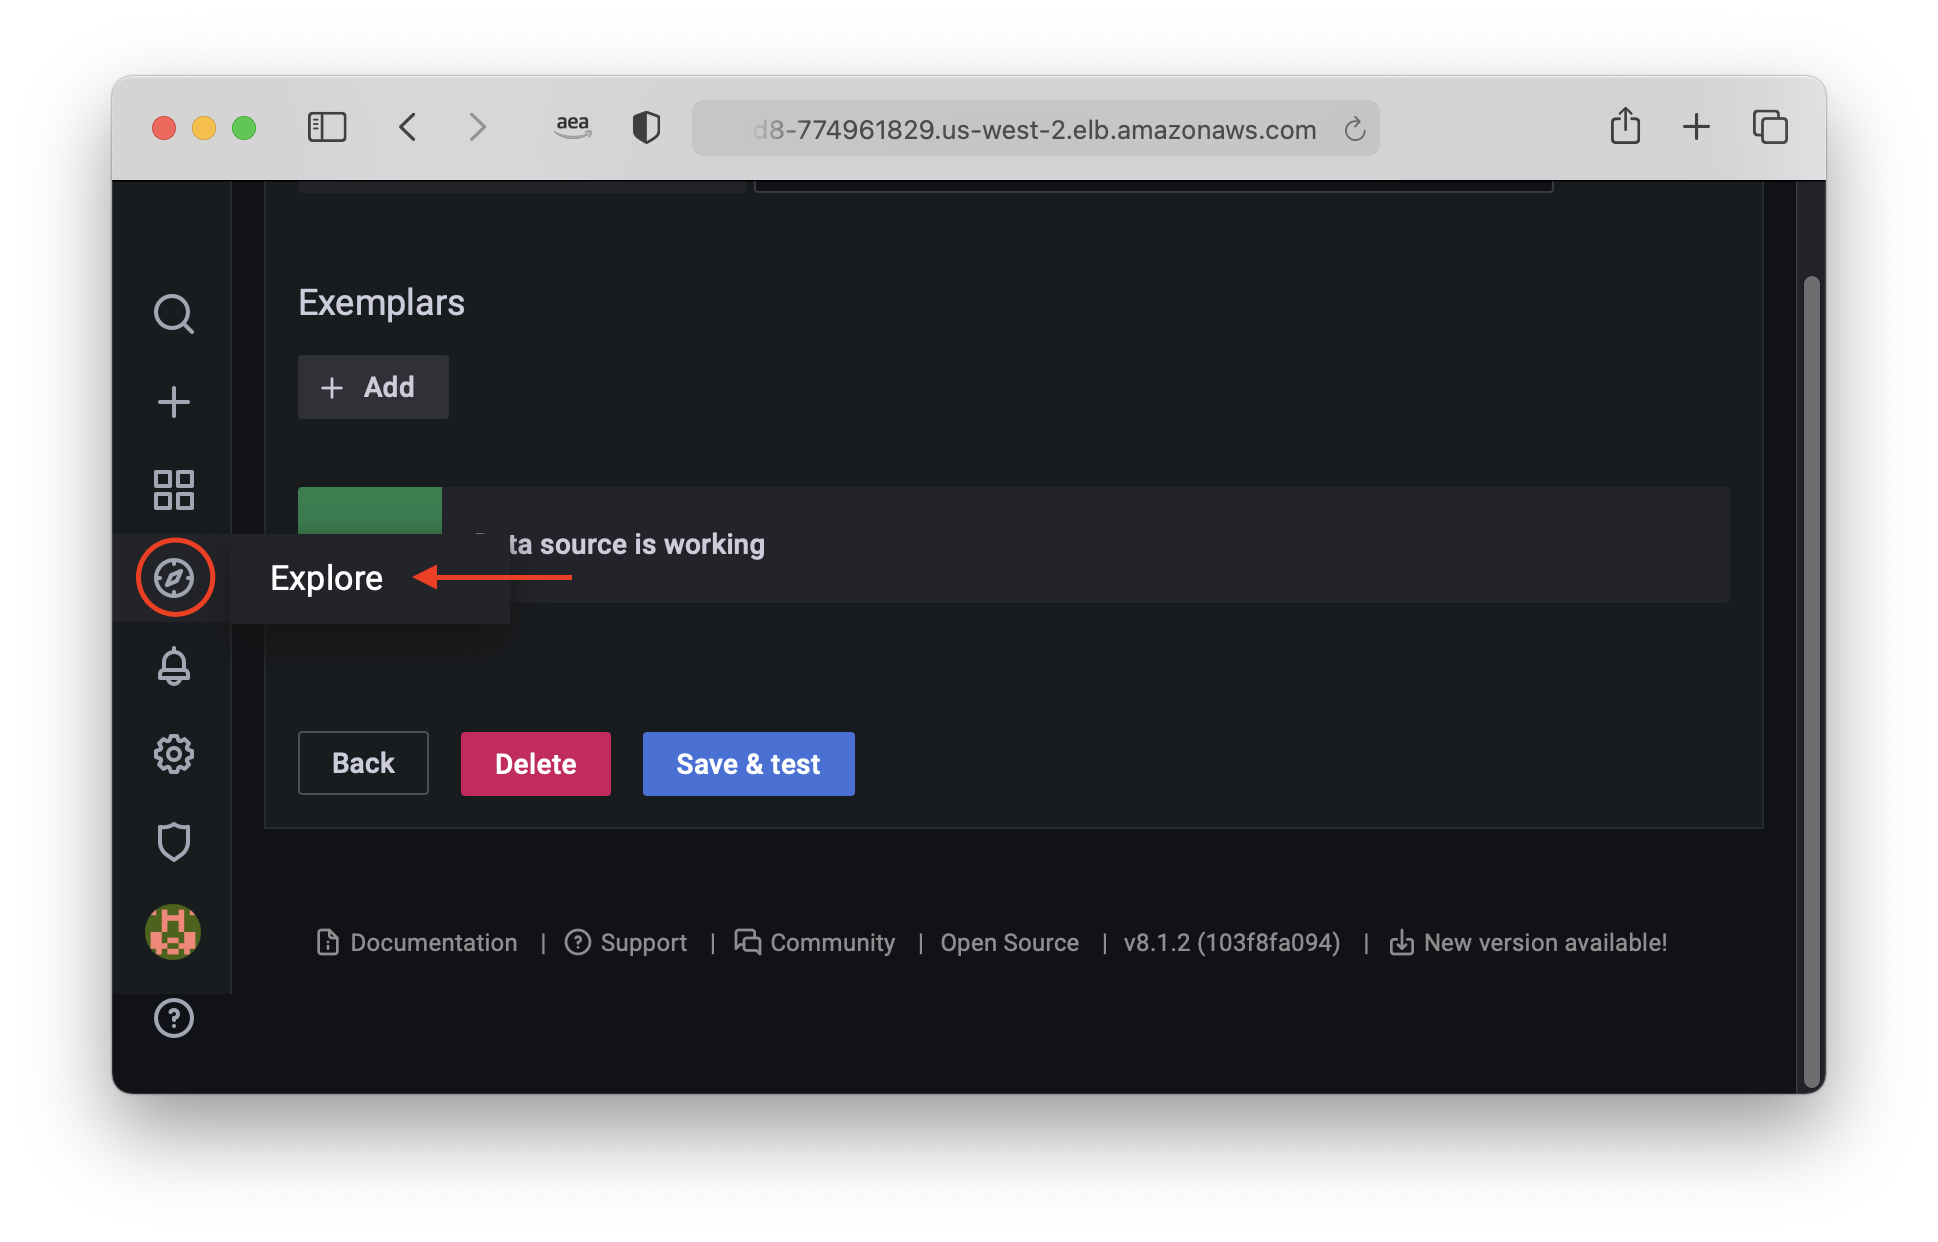
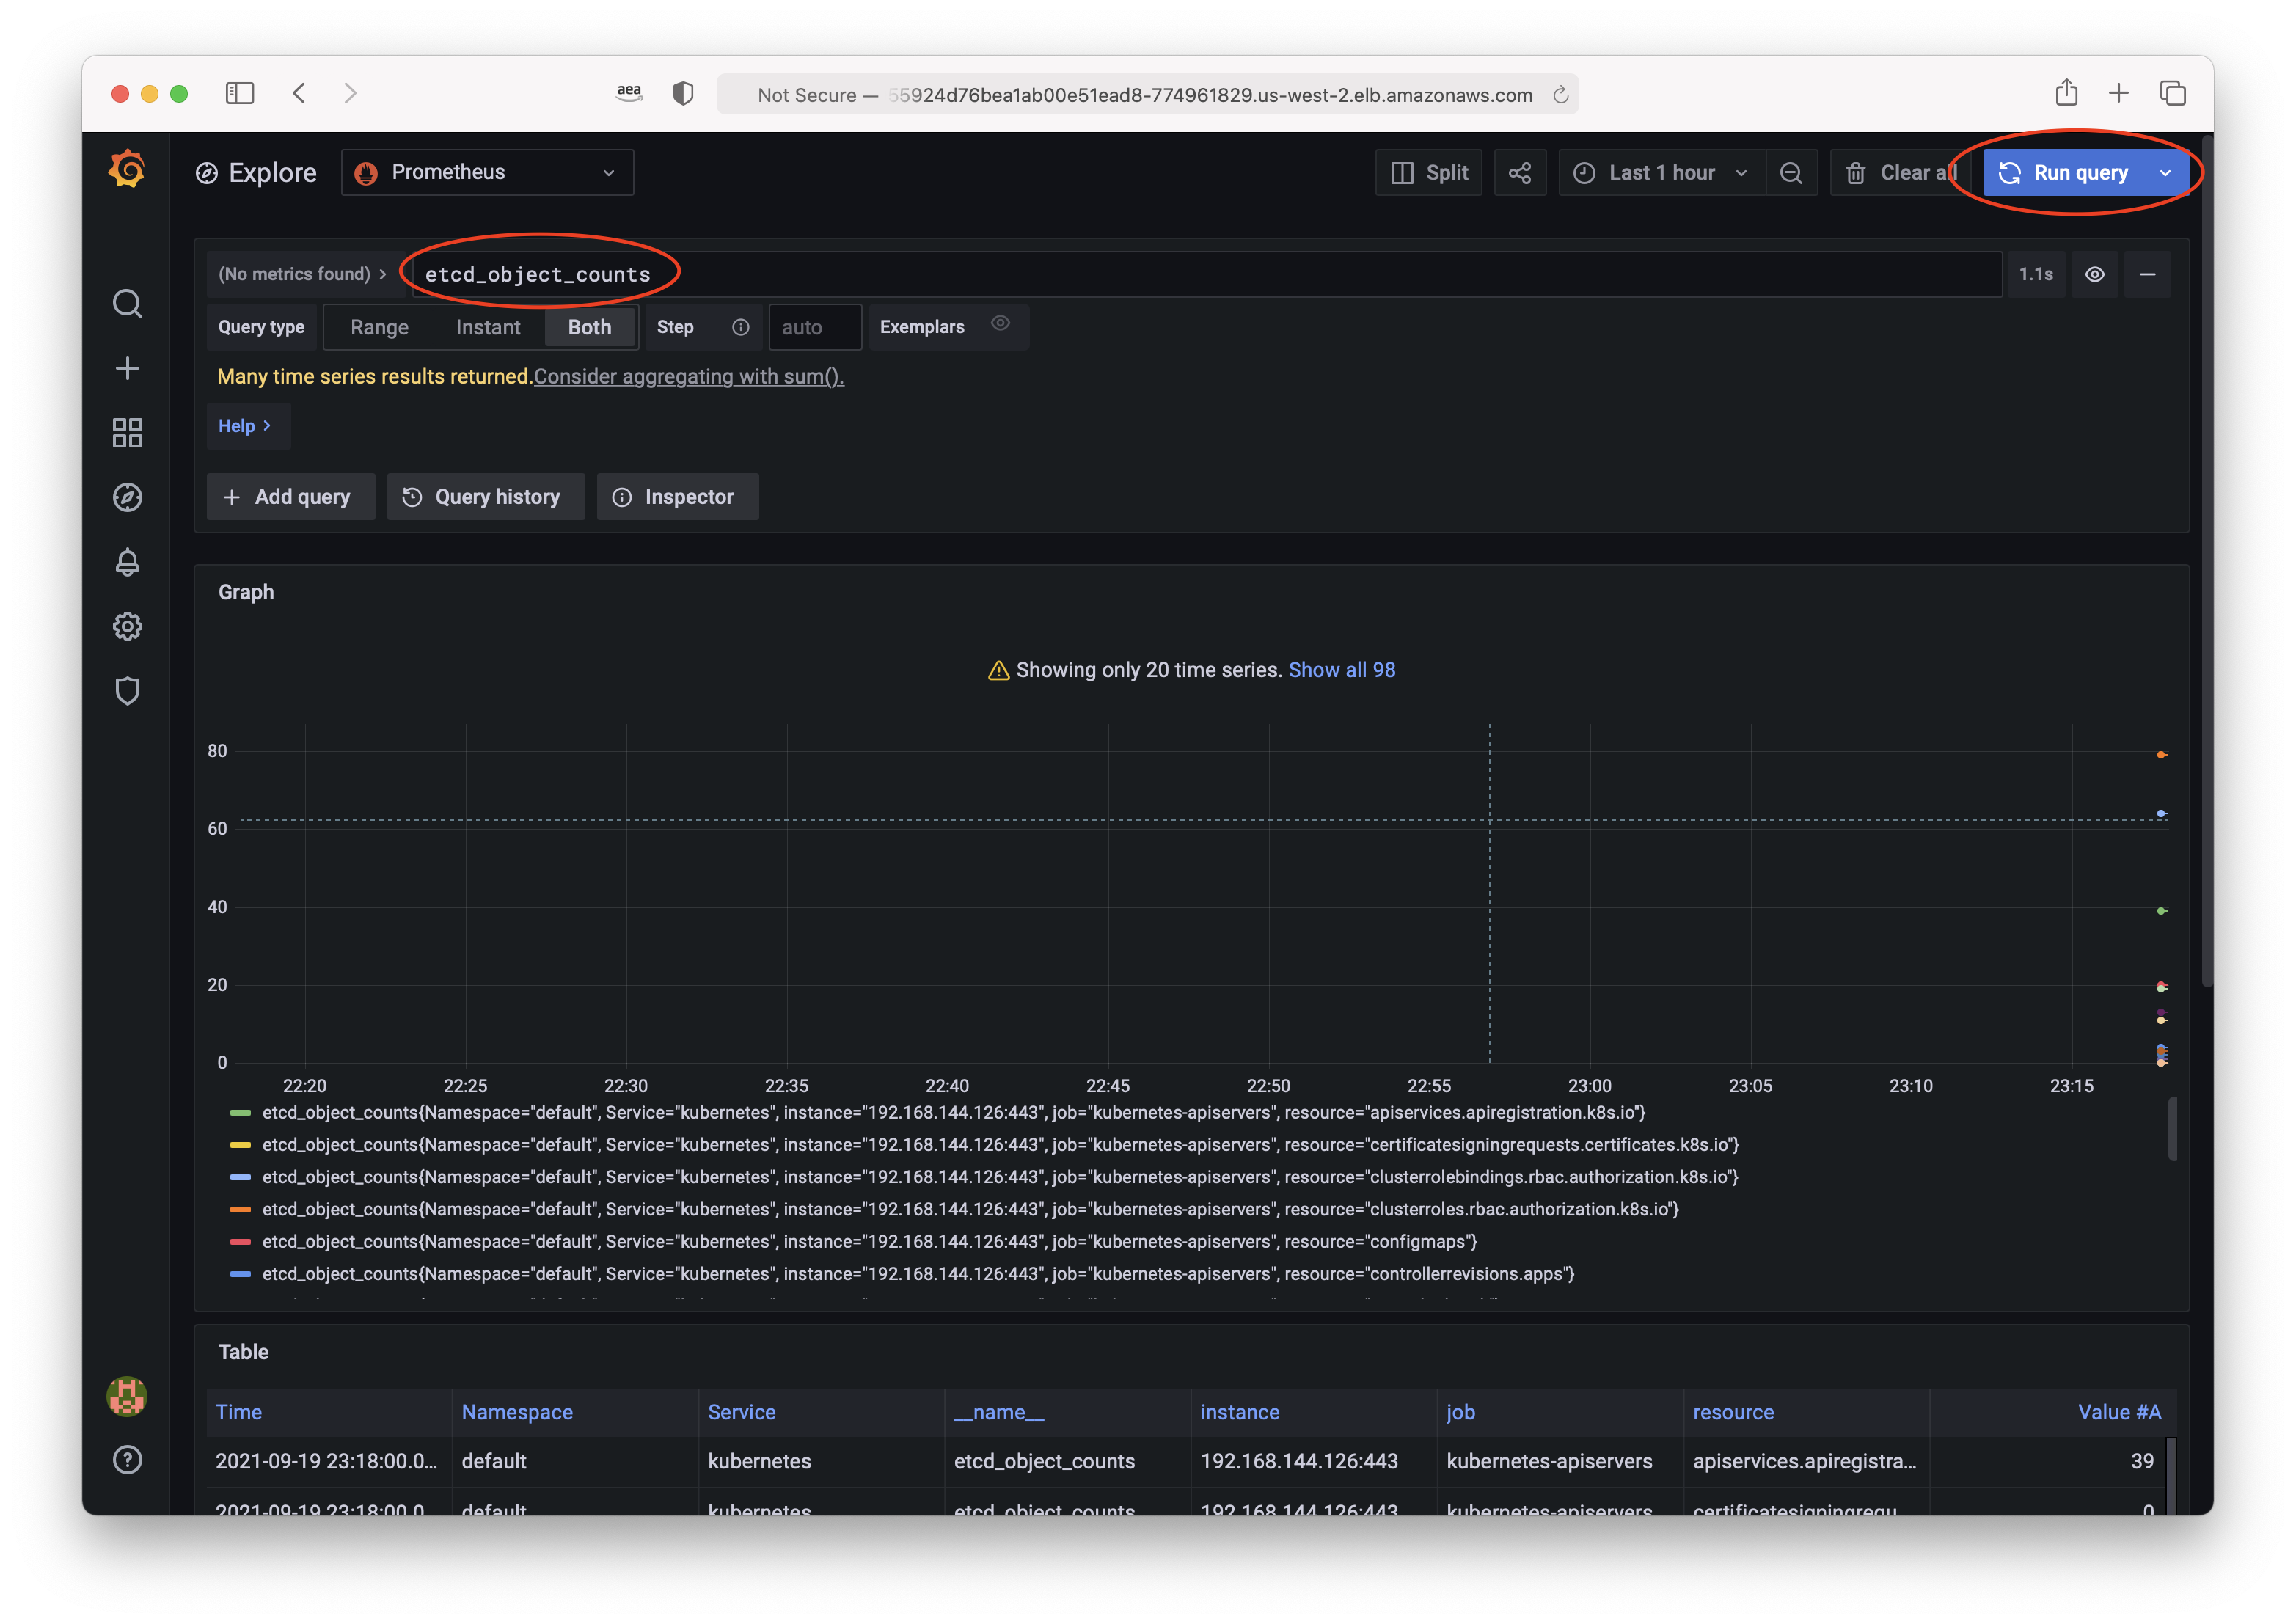
Let’s run a test PromQL query against our AMP
workspace. In the query bar type in etcd_object_counts, then click the Run Query button on the top right.
If this query returns data, we can confirm that we are 1) Ingesting Kubernetes Control Plane metrics to our AMP
workspace. 2) Grafana is able to connect to our AMP workspace.
Creating Kubernetes Grafana Dashboard
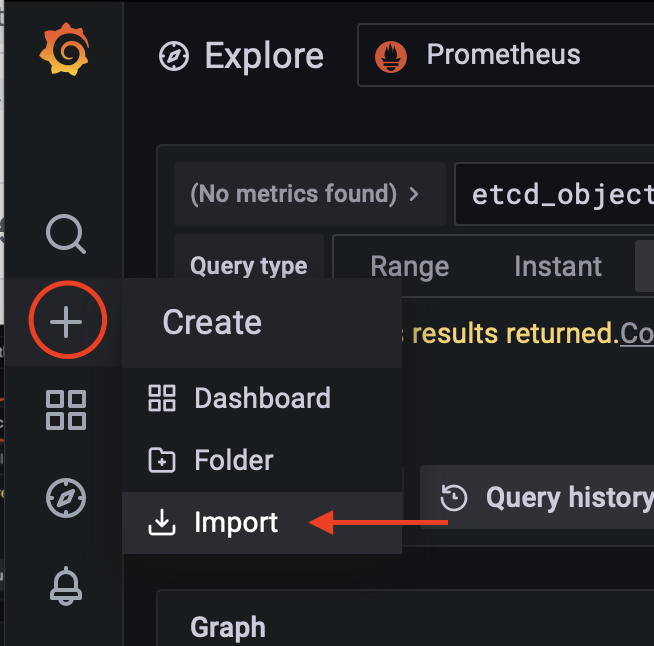
In the Nav select Create, and choose Import.
Enter 12006 in the field for the Grafana.com dashboard ID, and then click the Load button
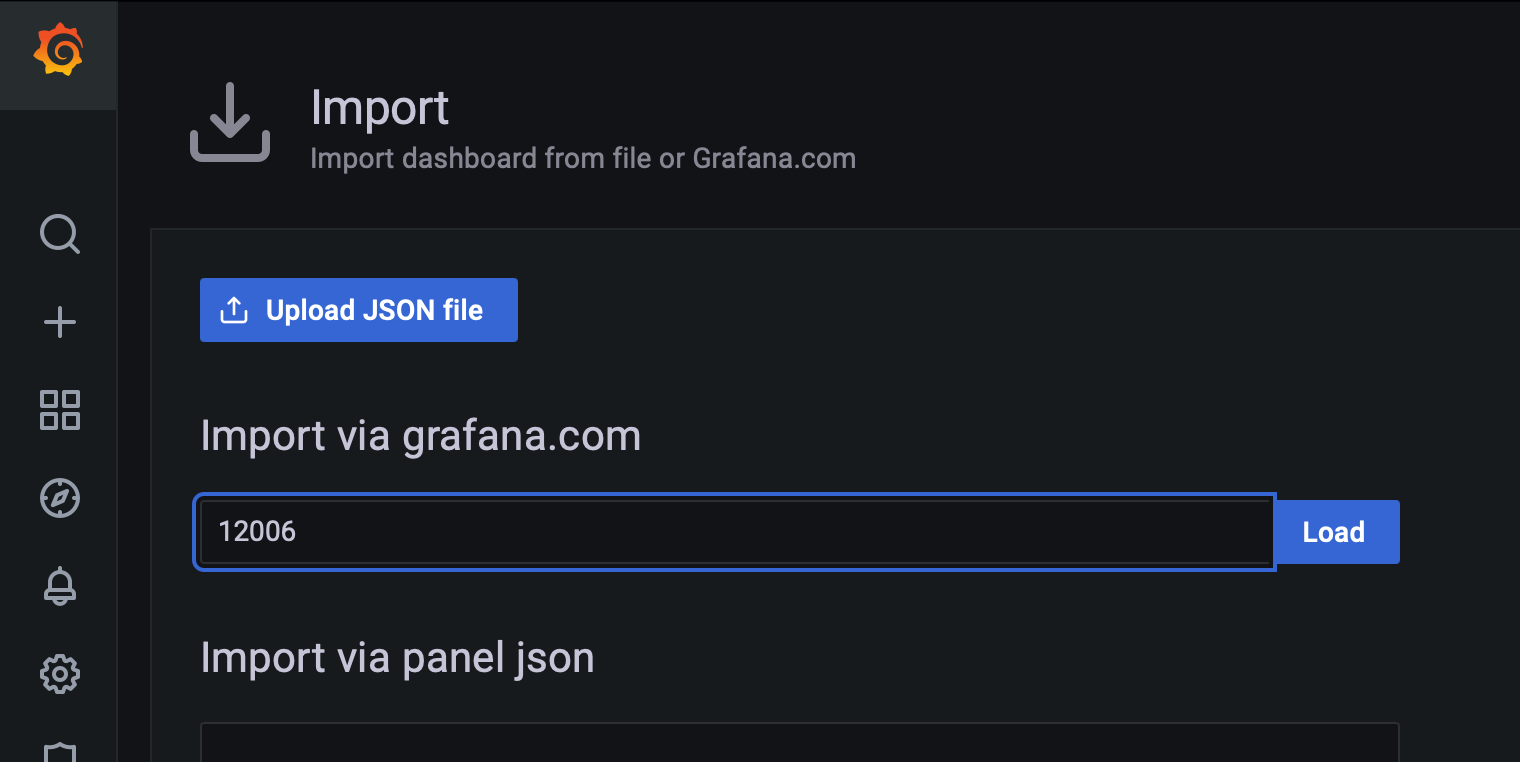
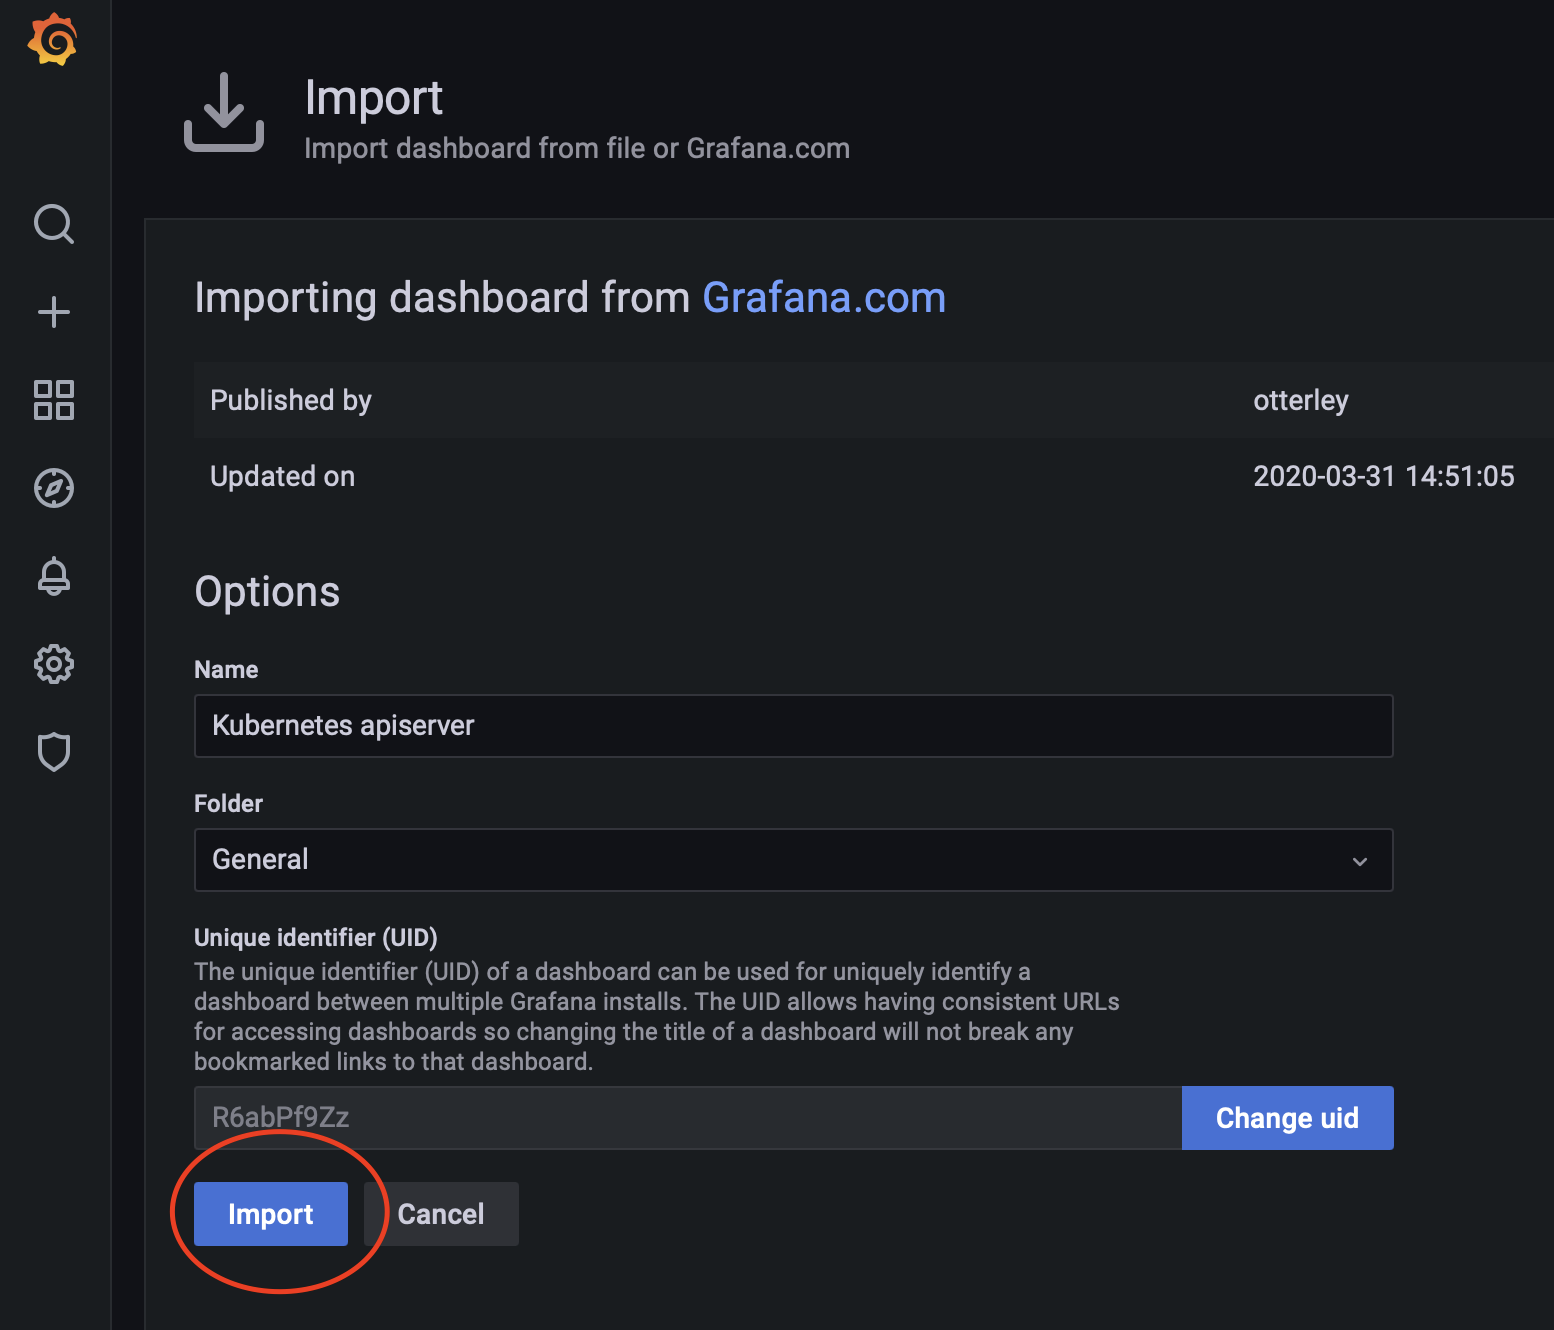
Click on Import
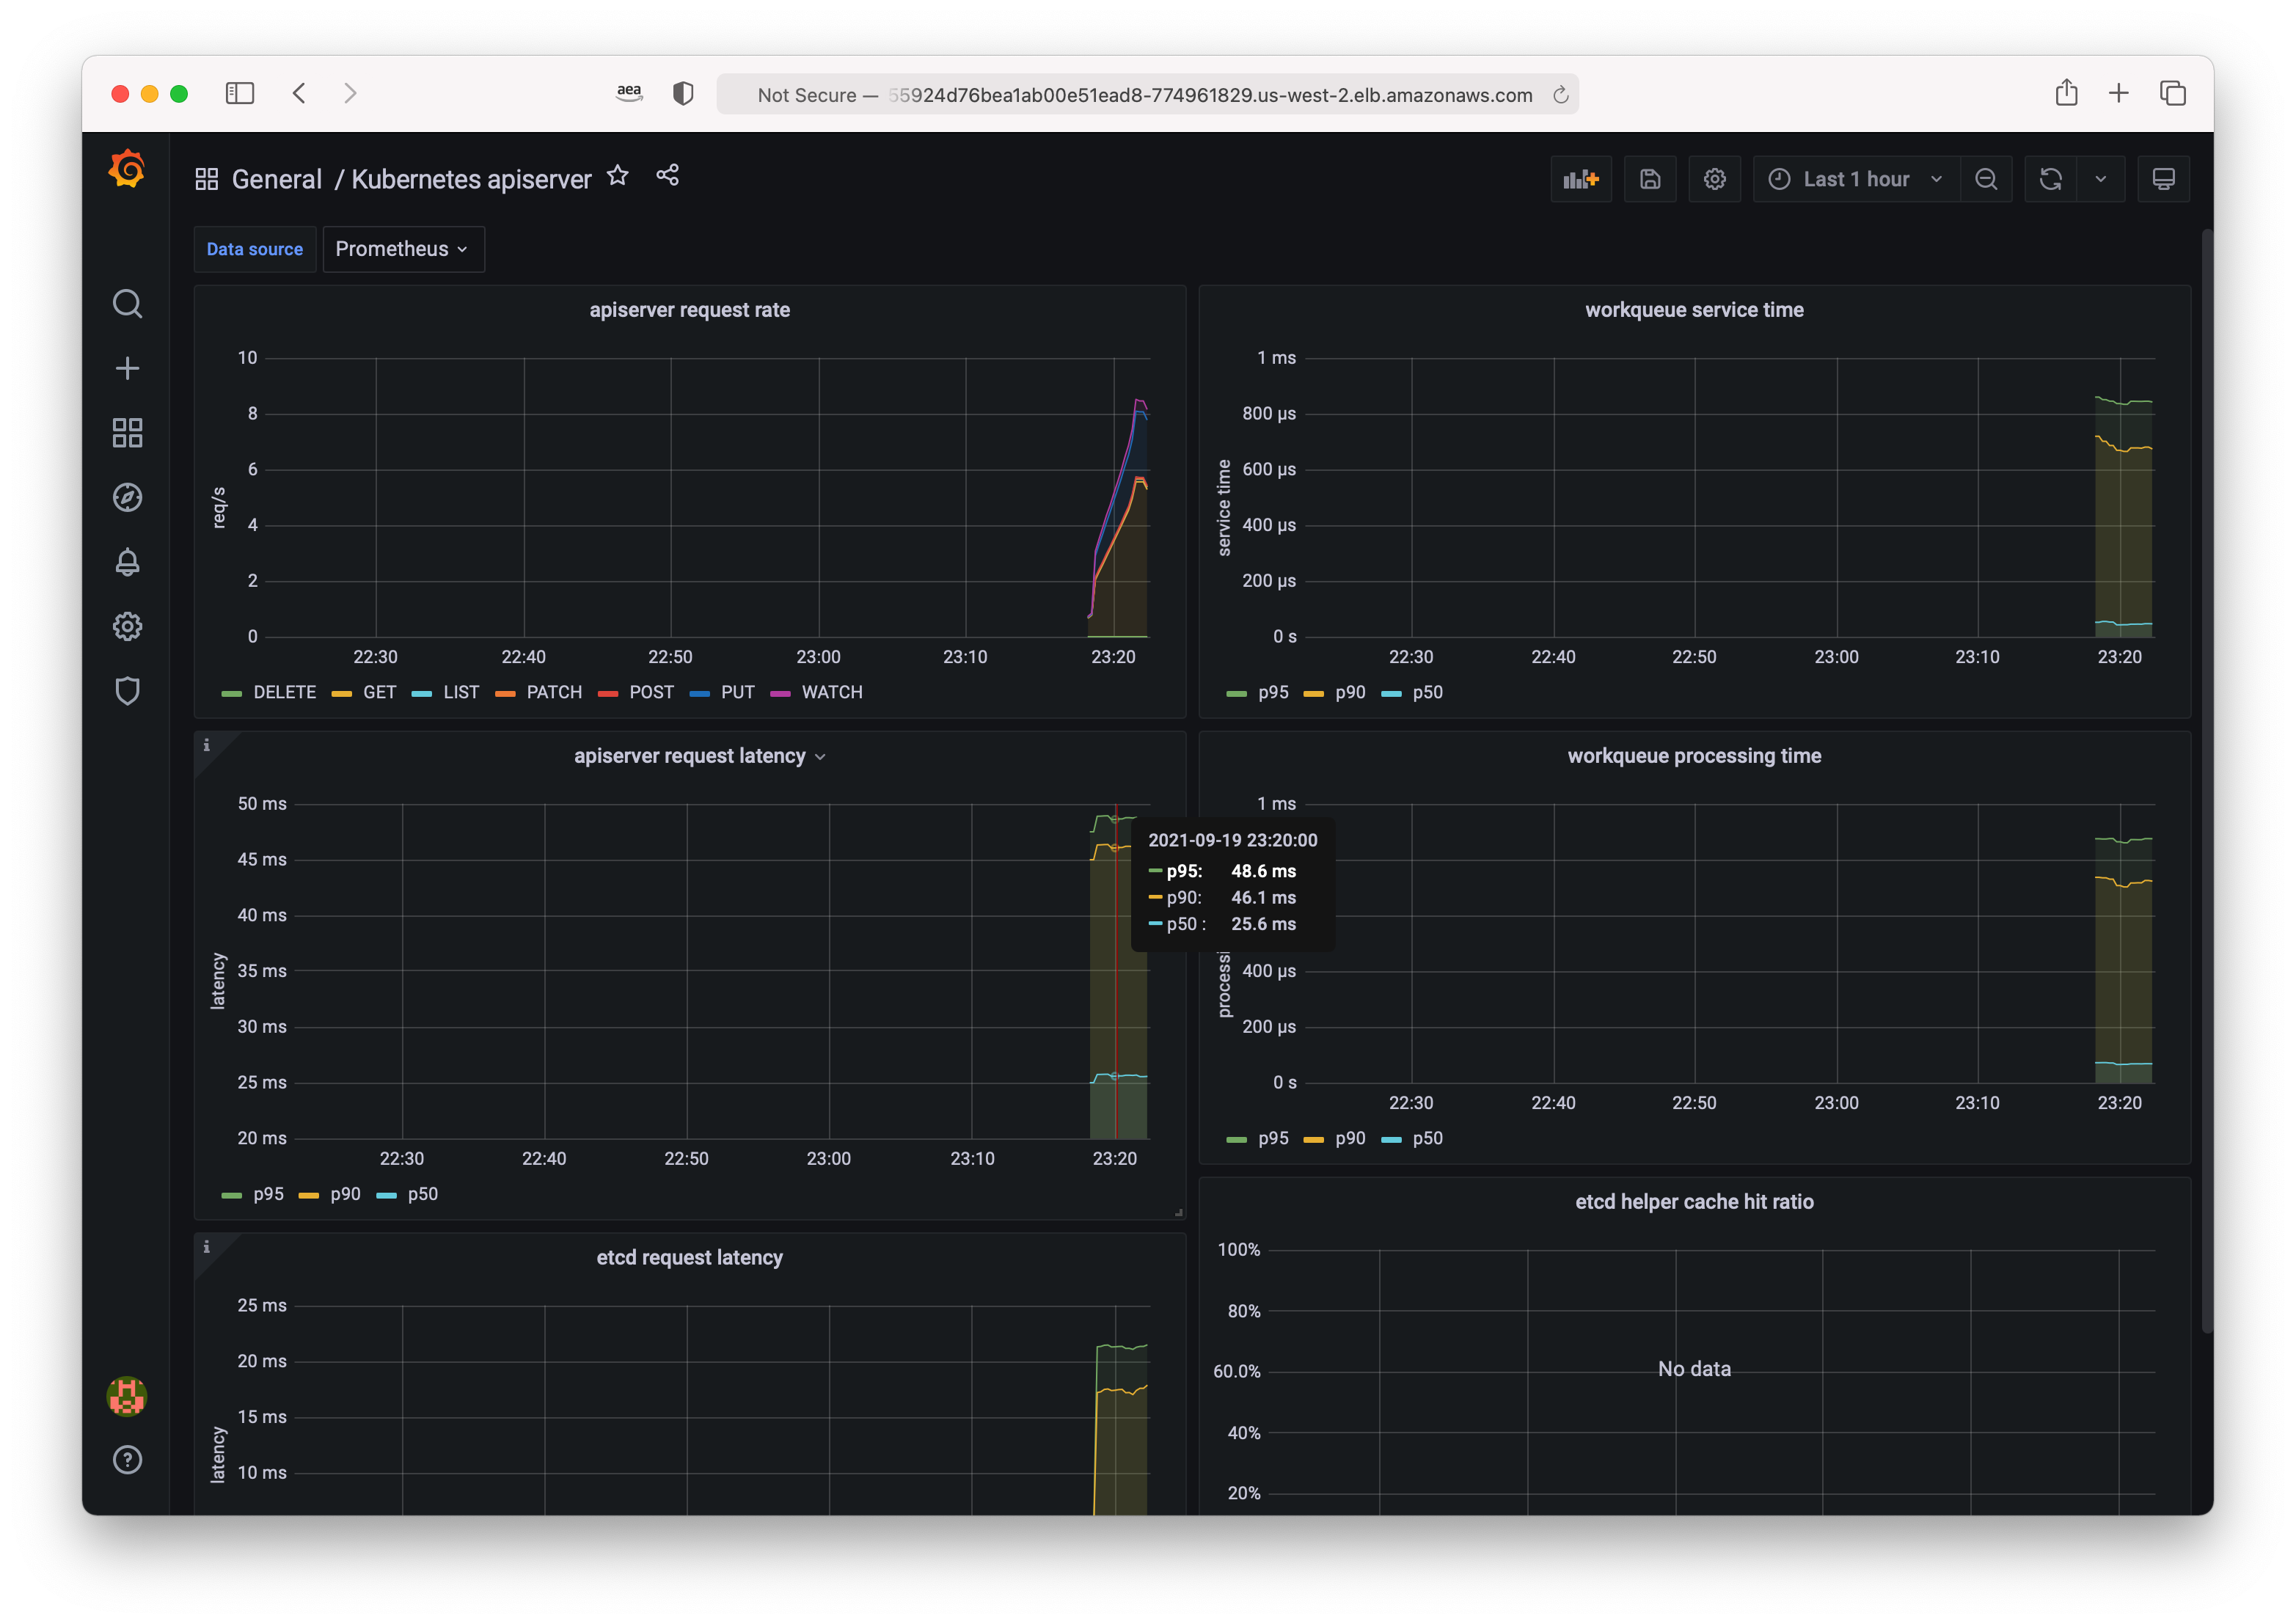
Now we can see a pre-made dashboard outlining our Kubernetes Control Plane metrics
Congratulations! You’ve now used the AWS Distro for OpenTelemetry to
- receive metrics from Container Insights
- receive traces from the deployed microservices
- store the telemetry data using CloudWatch, X-Ray, and AWS Managed Service for Prometheus
- Visualize using X-Ray, CloudWatch, and Grafana.