Amazon EKS Workshop > Advanced > Observability with AWS Distro for Open Telemetry > OTEL Collector > Deploying the Collector
Deploying the Collector
Deploying Open Telemetry Collector
Set variables in the OTEL collector’s kubernetes manifest file:
envsubst < kubernetes/adot/otel-container-insights-infra.yaml | sponge kubernetes/adot/otel-container-insights-infra.yaml
Install the OTEL collector to the EKS Cluster as a DaemonSet:
kubectl apply -f kubernetes/adot/otel-container-insights-infra.yaml
Check to see that the OTEL collector’s DaemonSet is running on each node:
At this point the OTEL collector is installed and sending CloudWatch Insights metrics to CloudWatch.
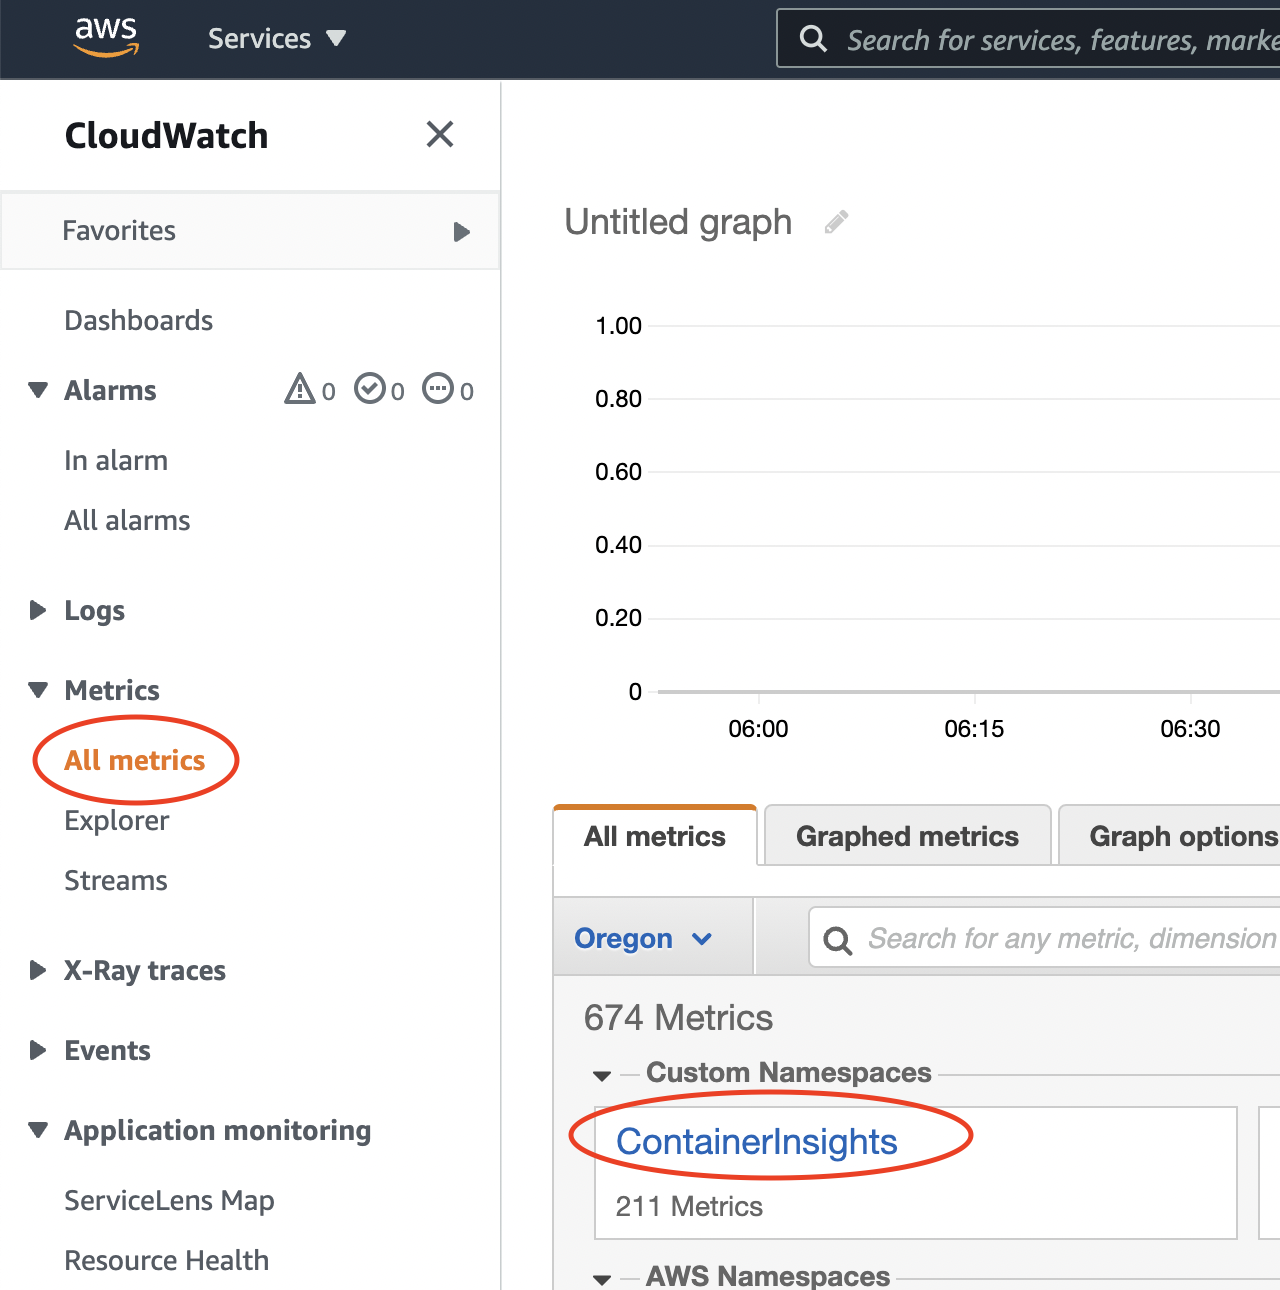
Open your CloudWatch console, and head to Metrics > All Metrics.
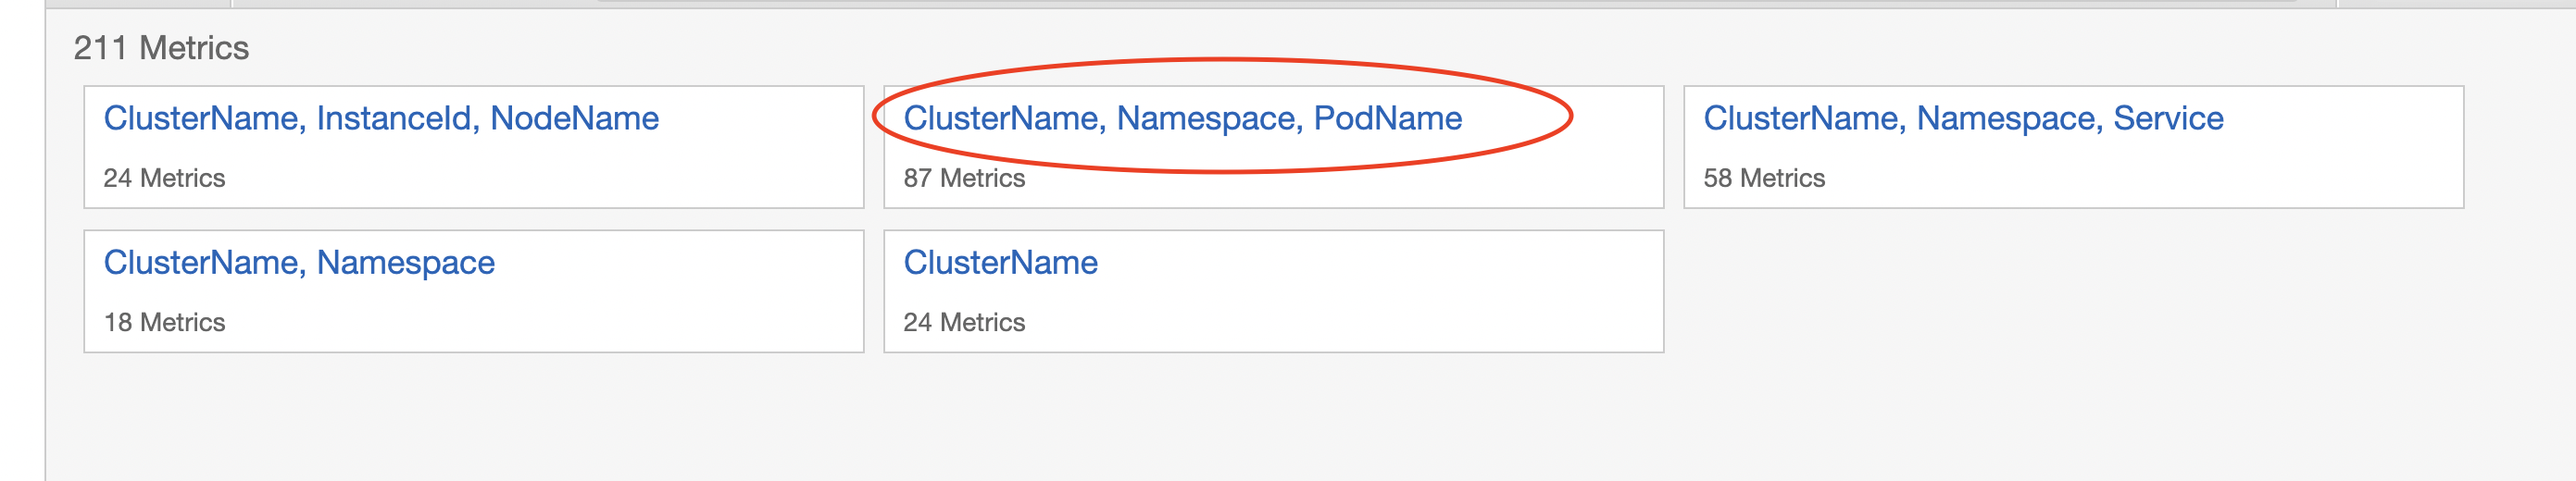
Then select the Pod level metrics:
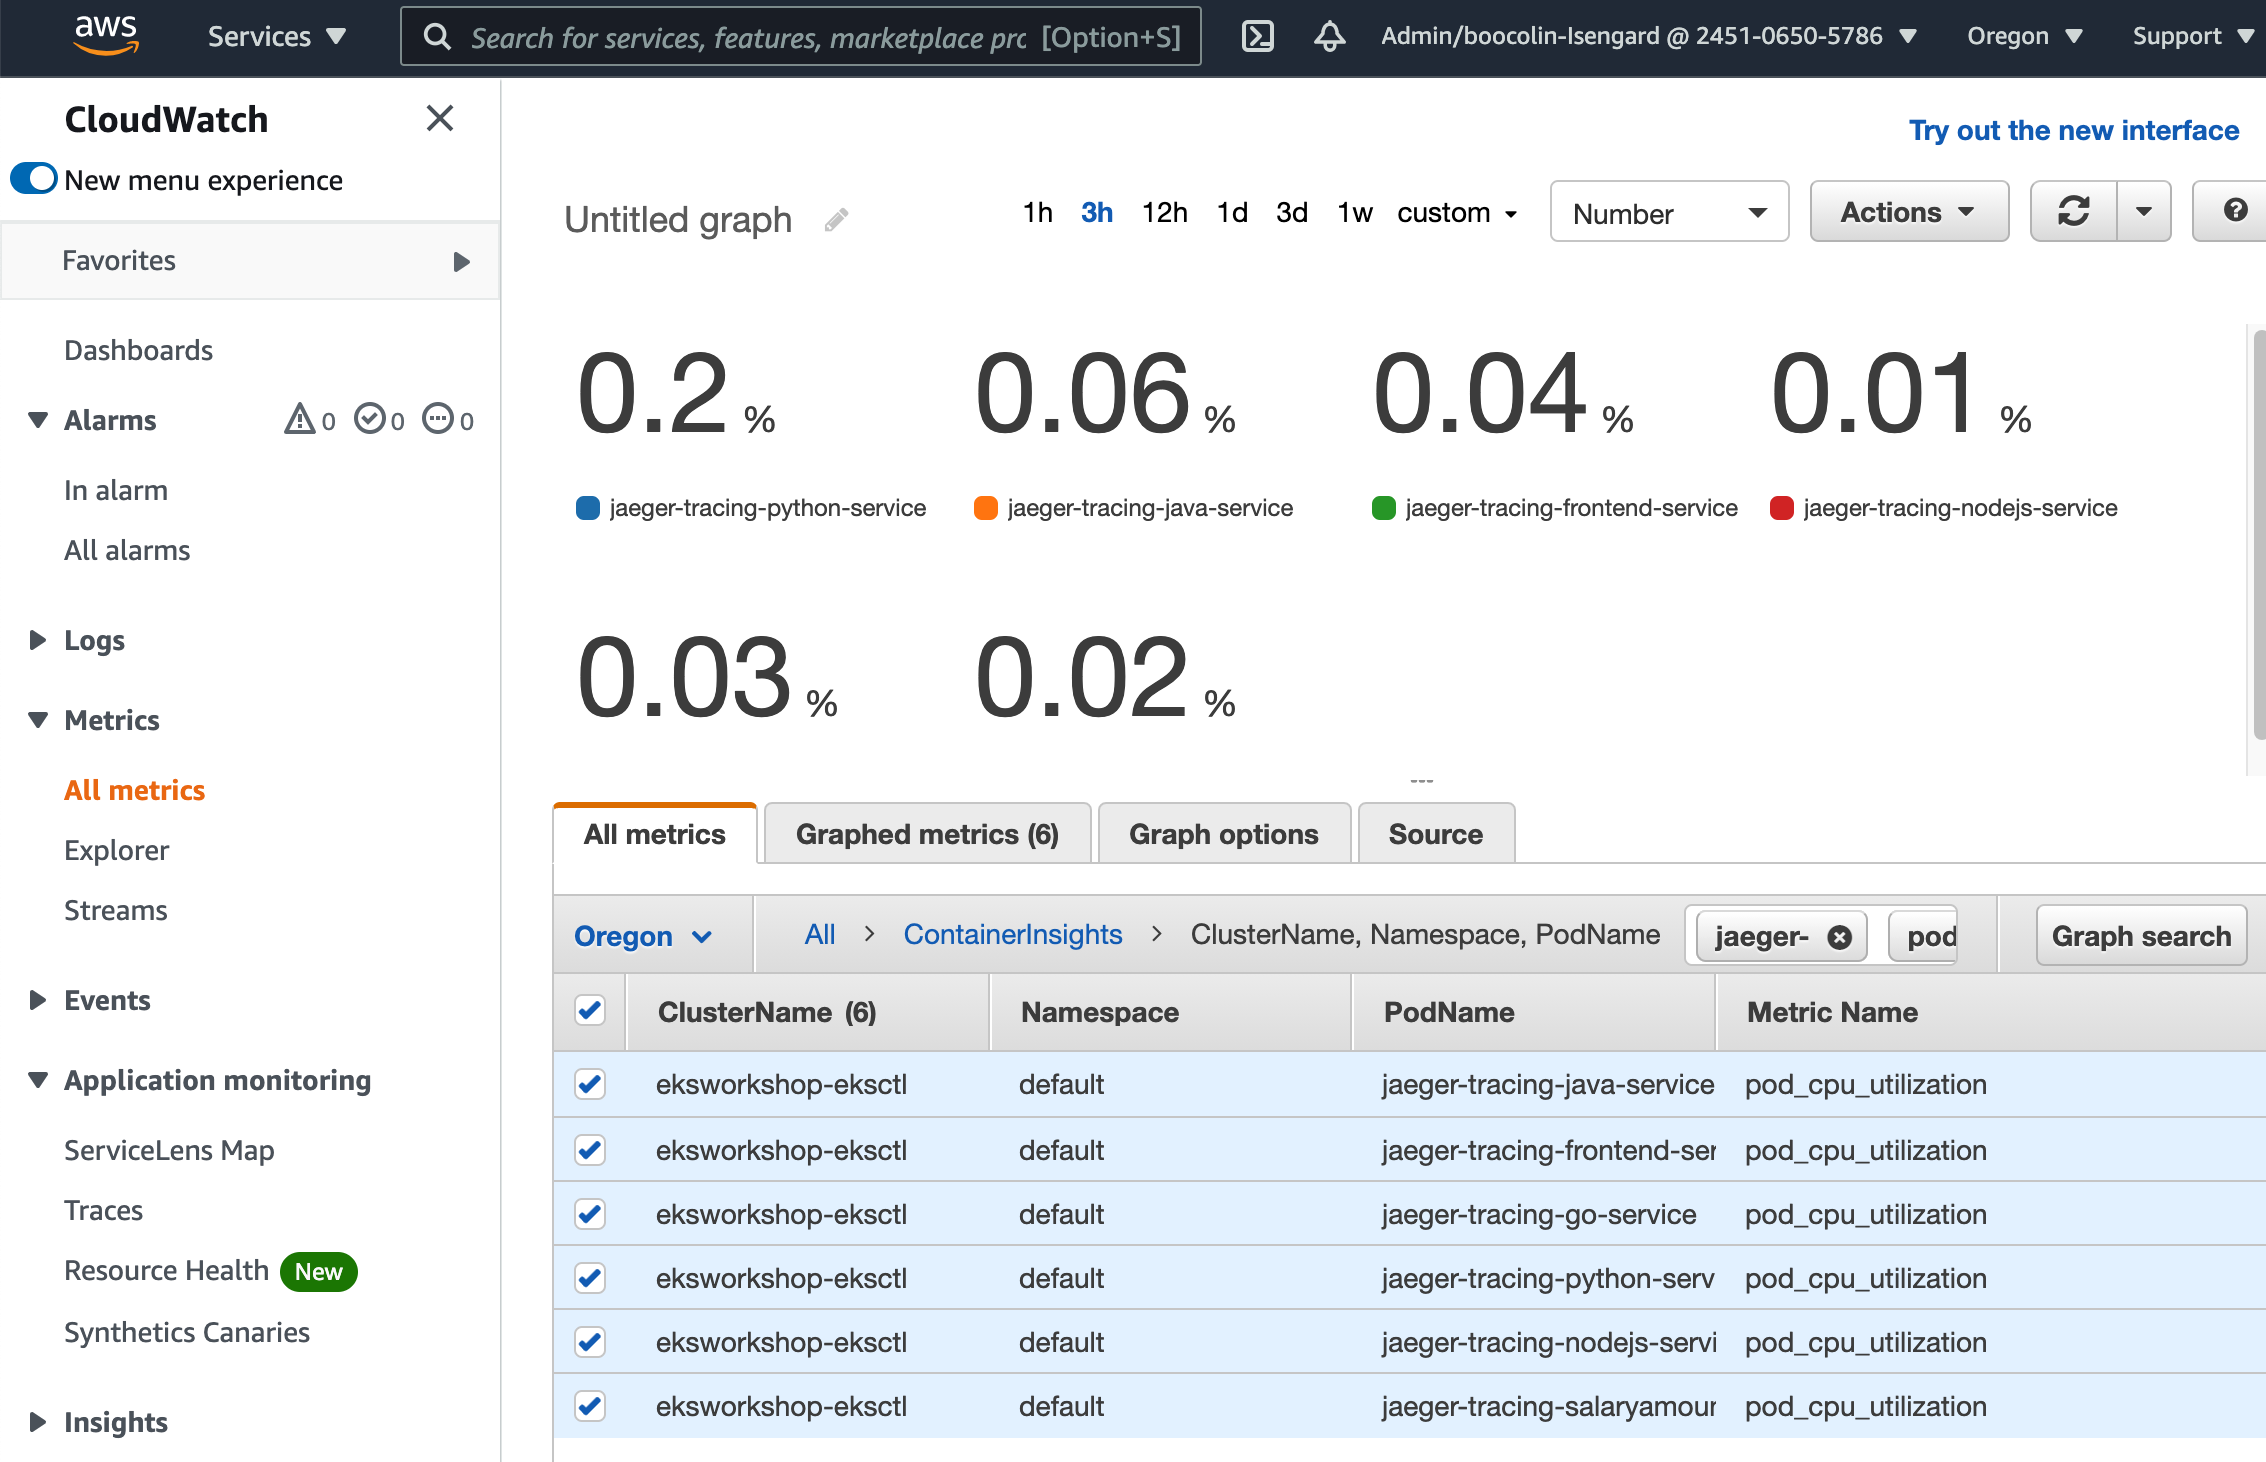
Filter to just CPU Utilization, and change the visualization to be of type Number. And you’ll have a dashboard of the deployed Pod’s CPU Utilization: