Kibana
Finally Let’s log into Kibana to visualize our logs.
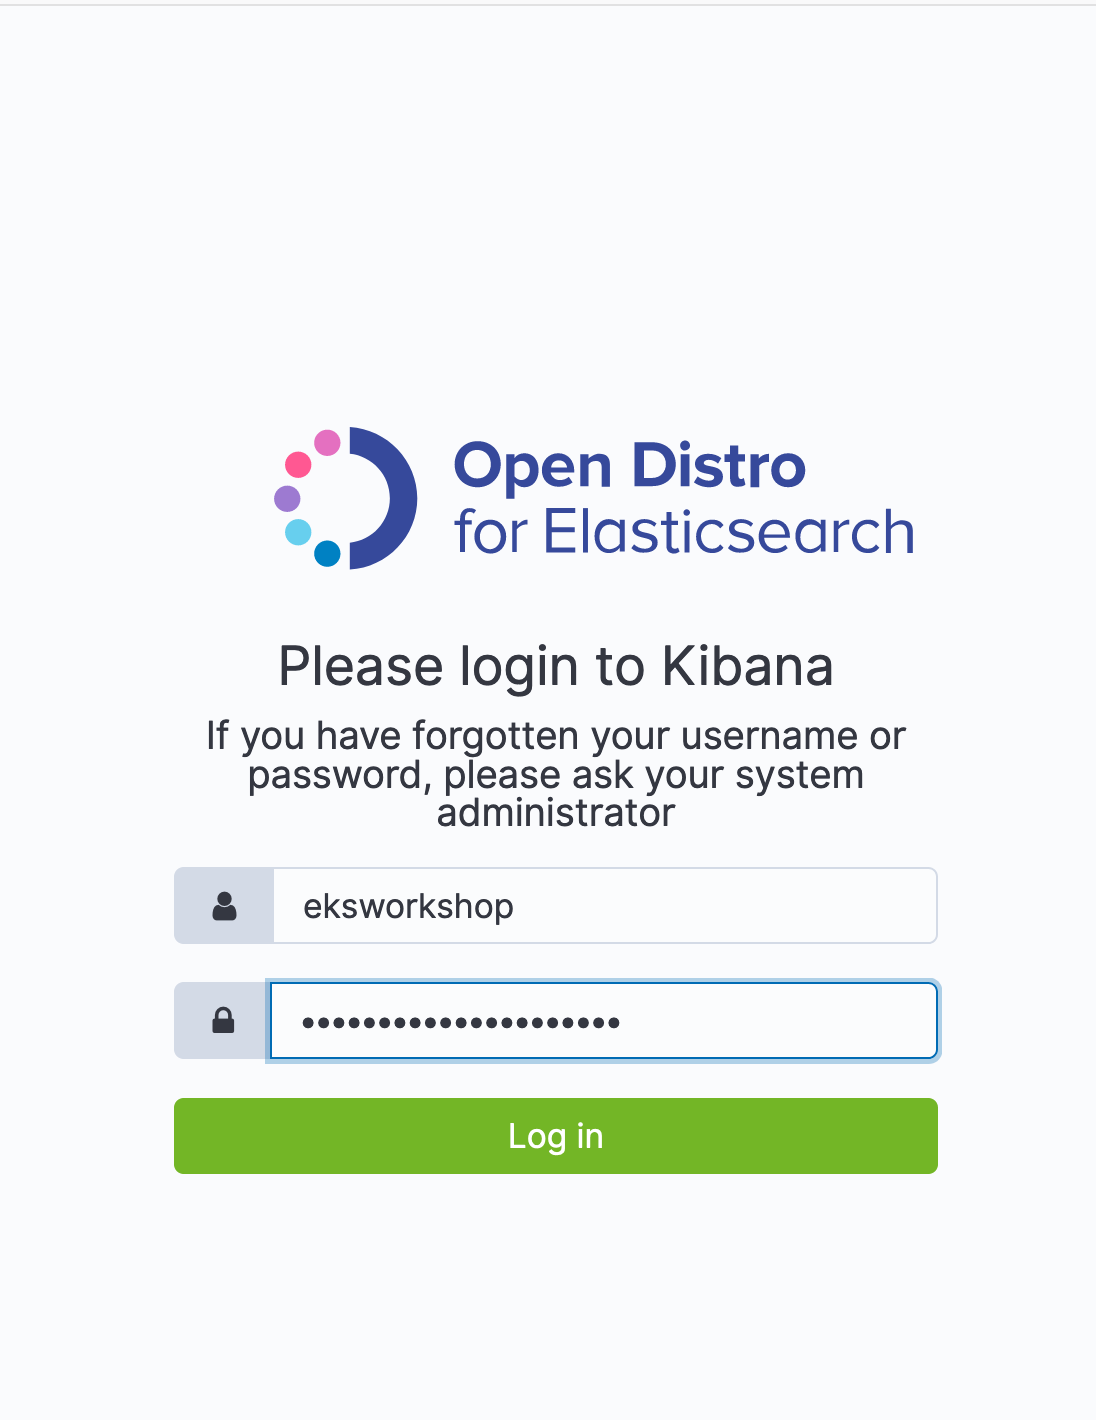
echo "Kibana URL: https://${ES_ENDPOINT}/_plugin/kibana/
Kibana user: ${ES_DOMAIN_USER}
Kibana password: ${ES_DOMAIN_PASSWORD}"
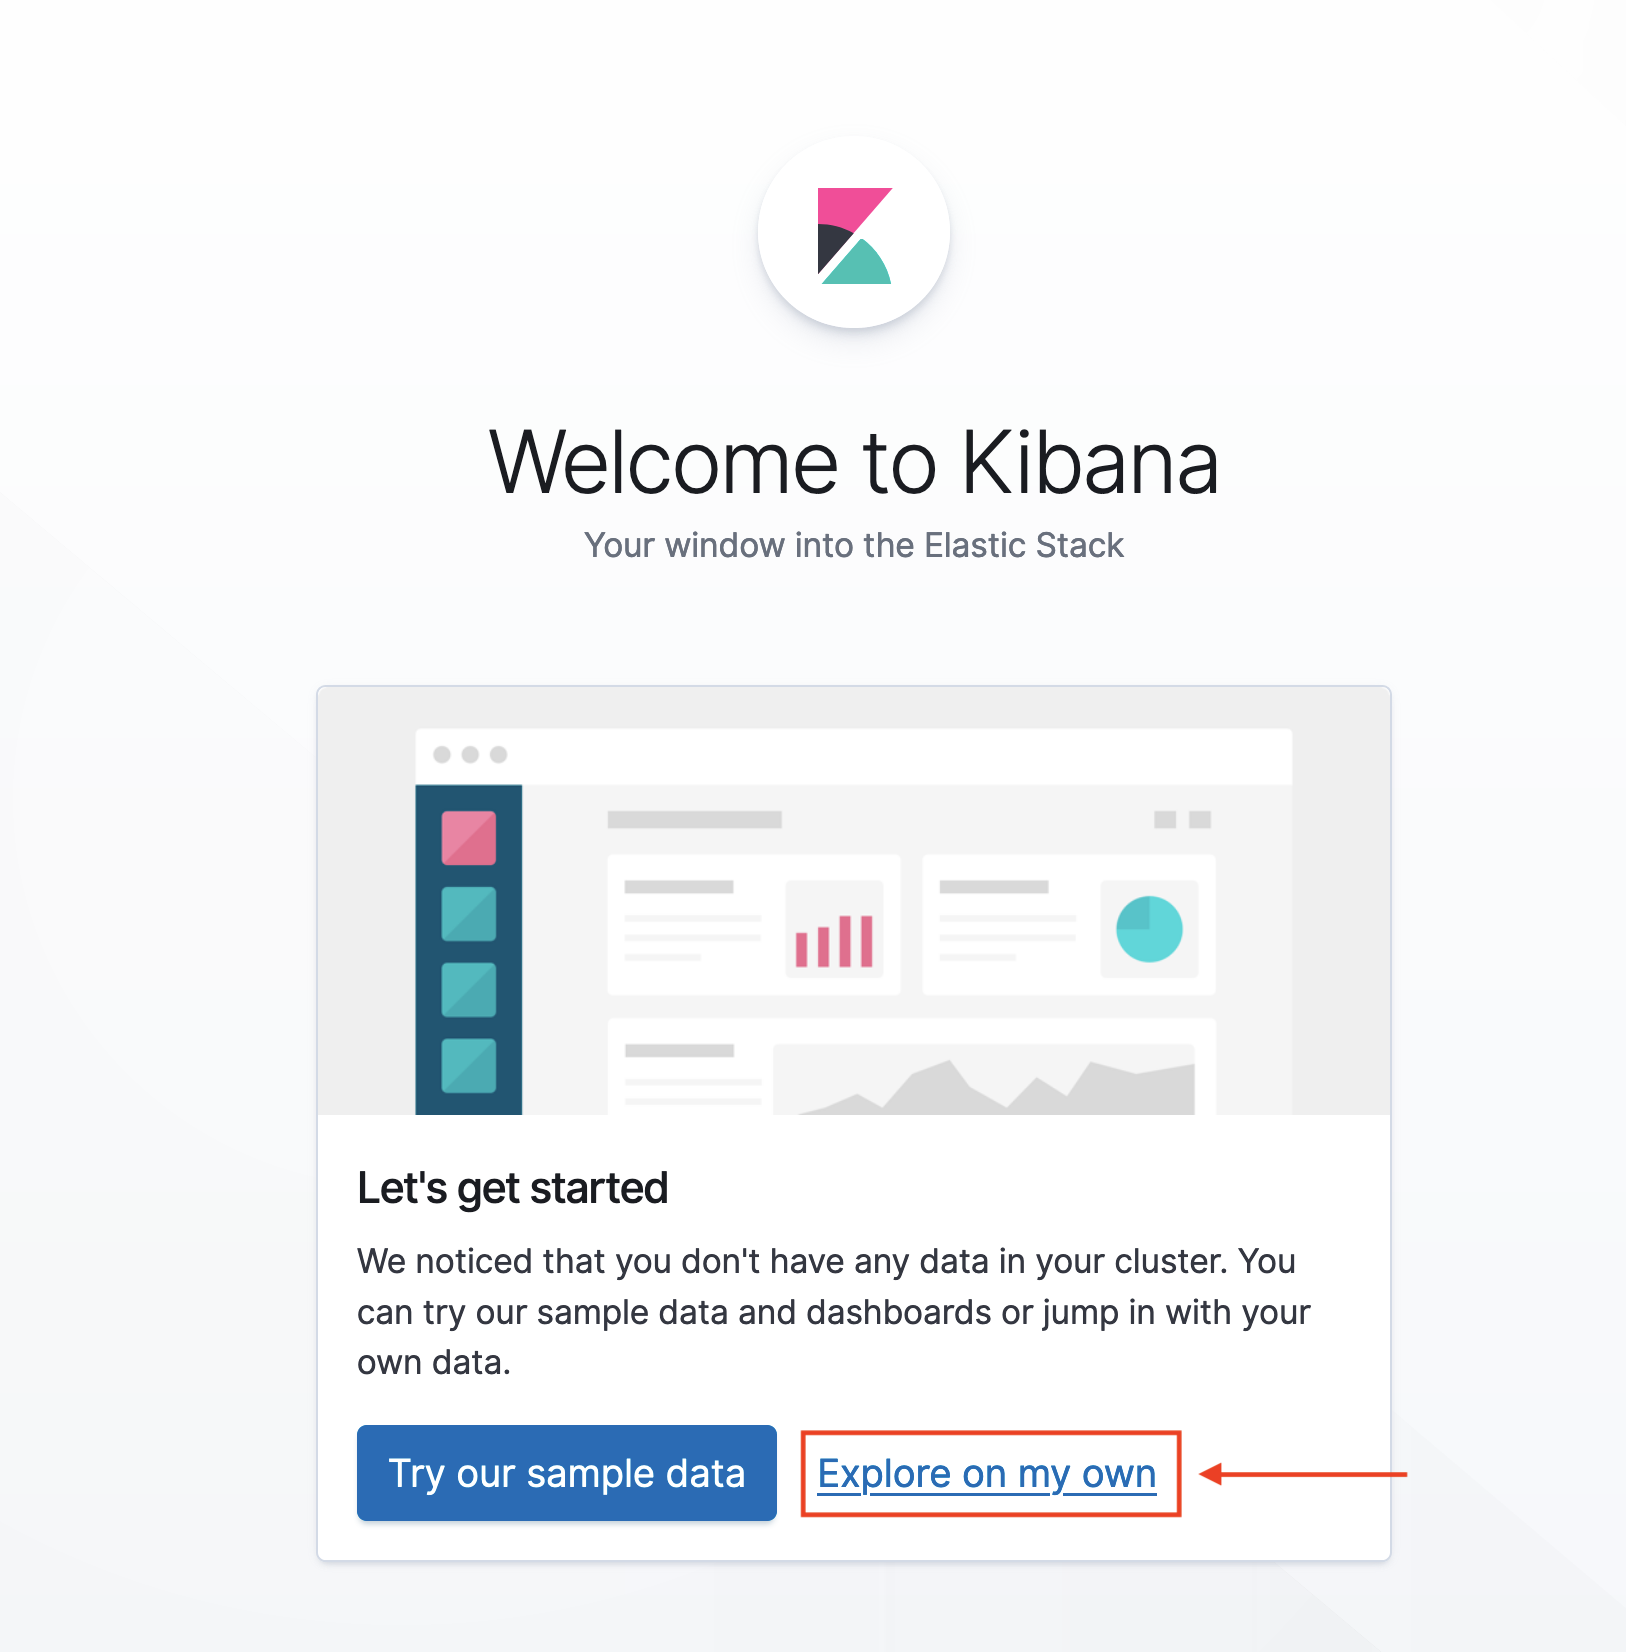
From the Kibana Welcome screen select Explore on my own
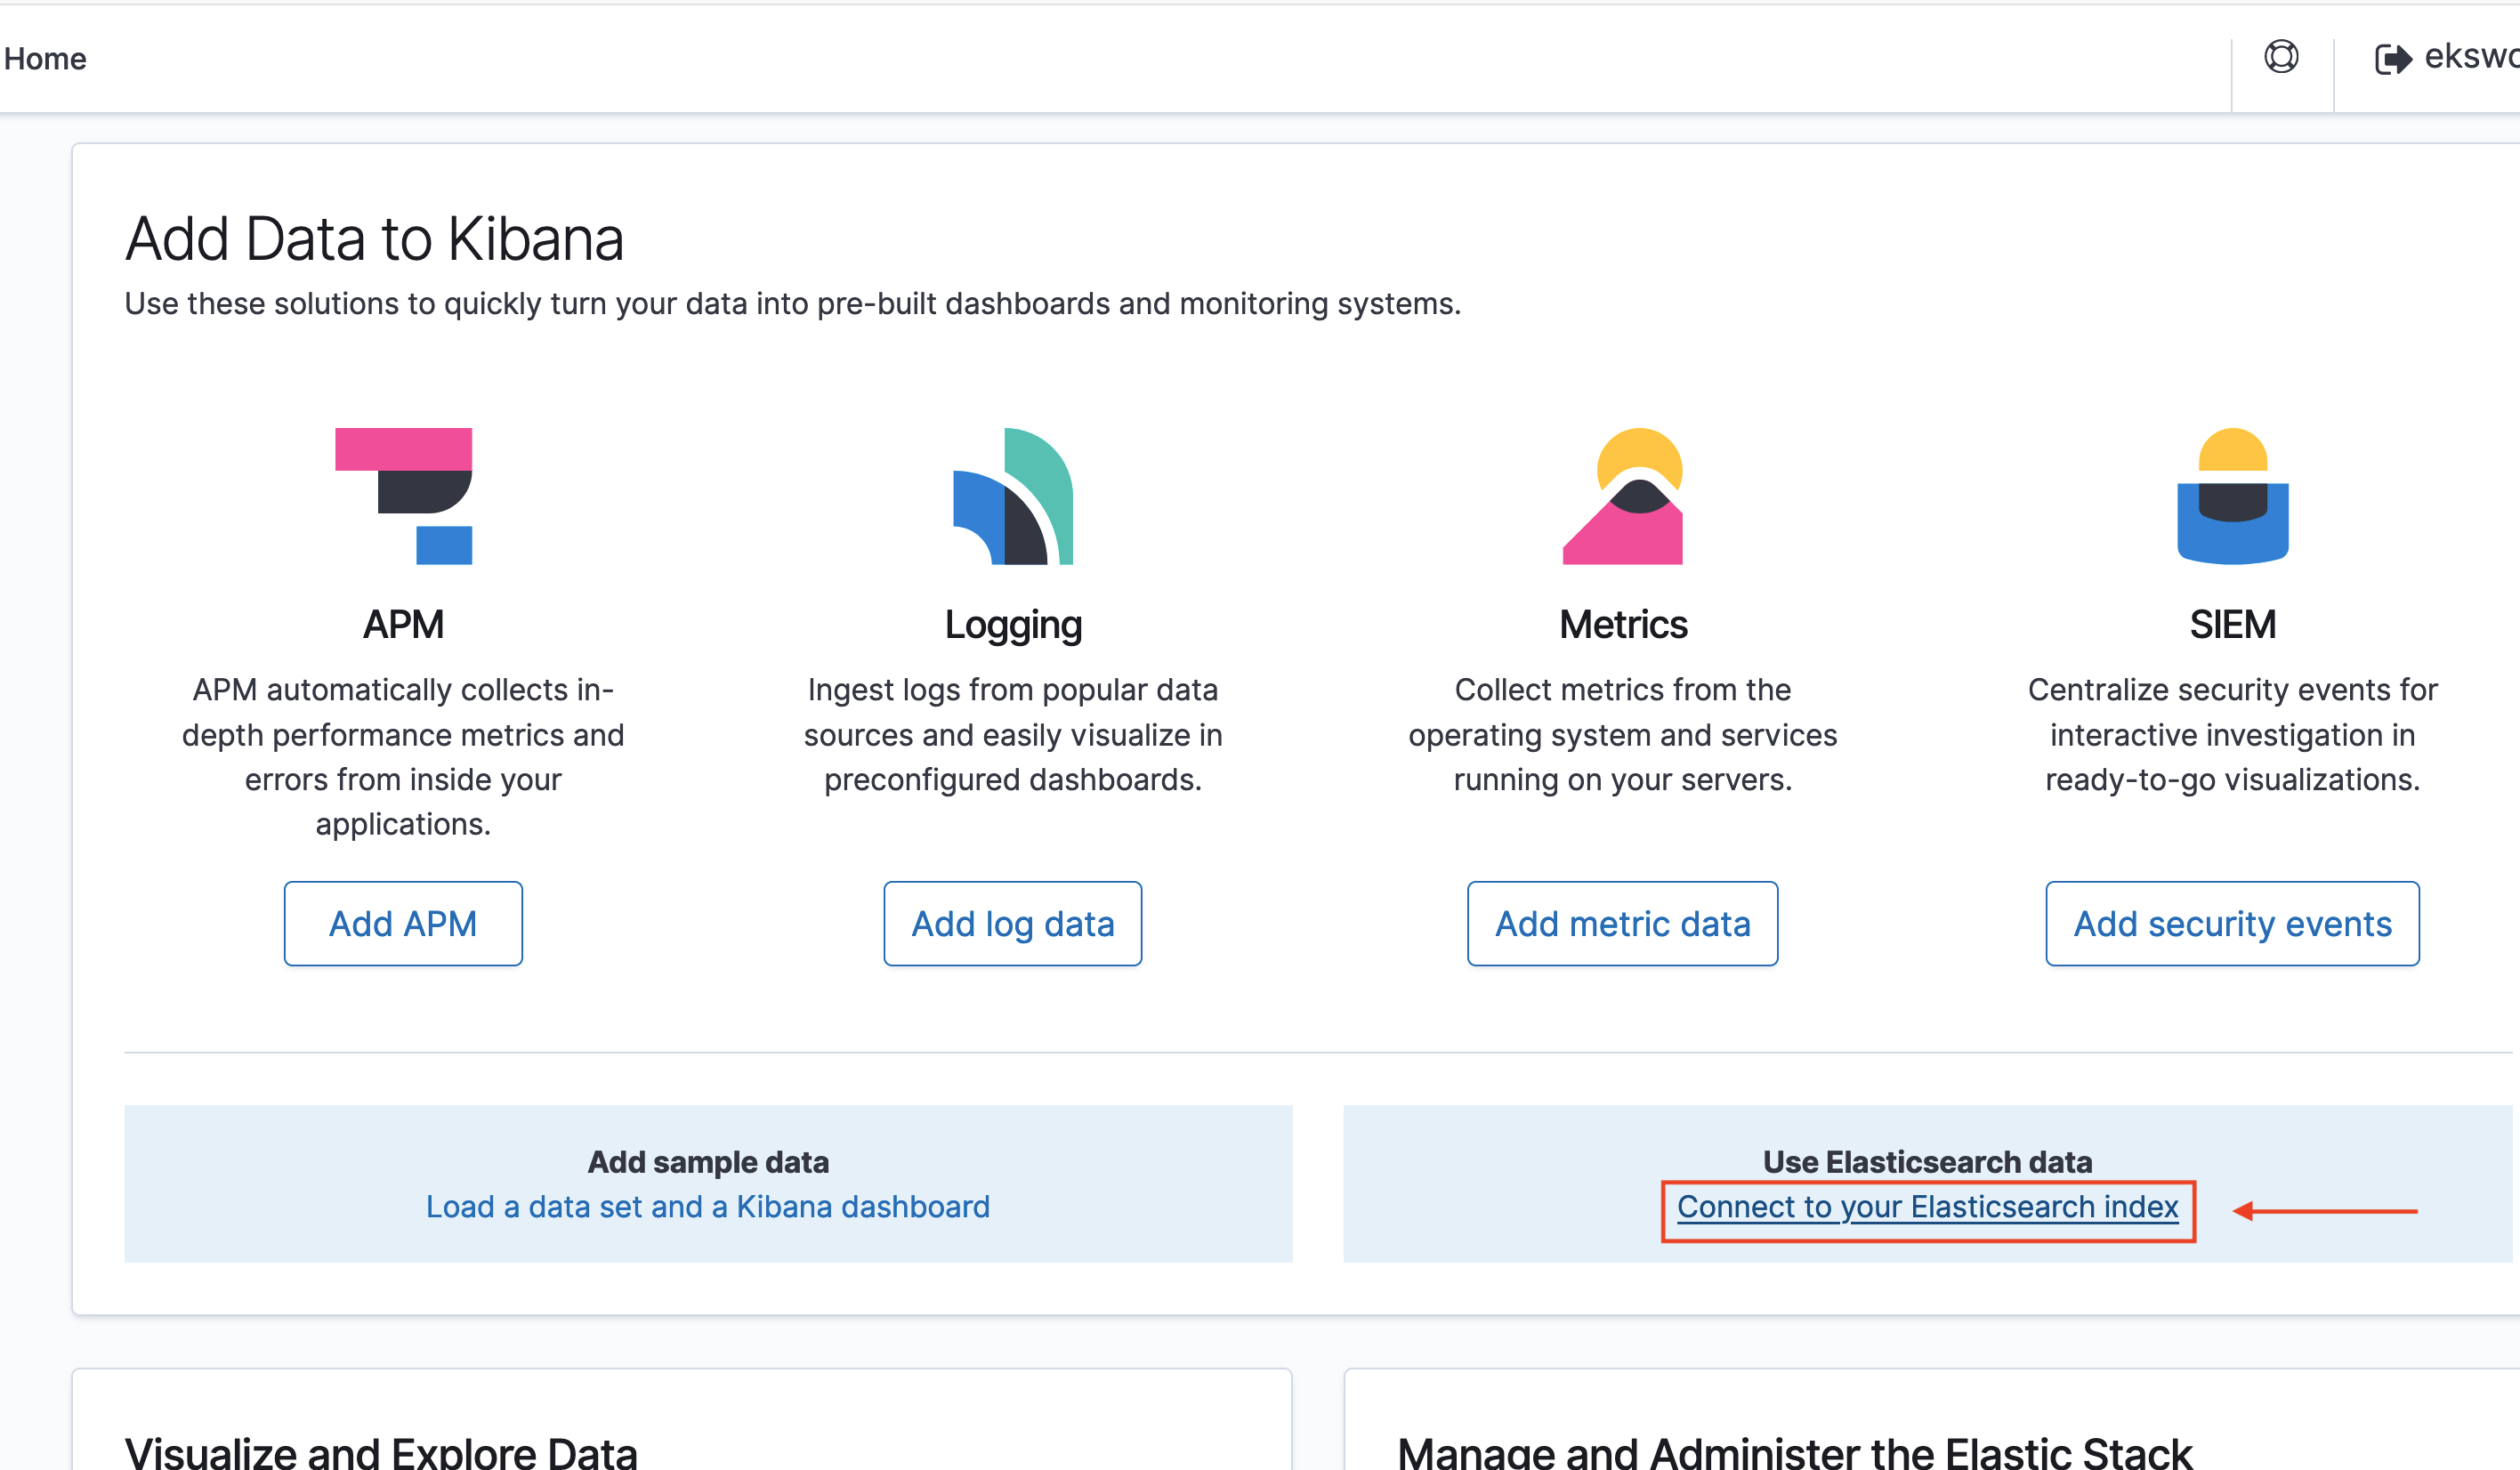
Now click Connect to your Elasticsearch index
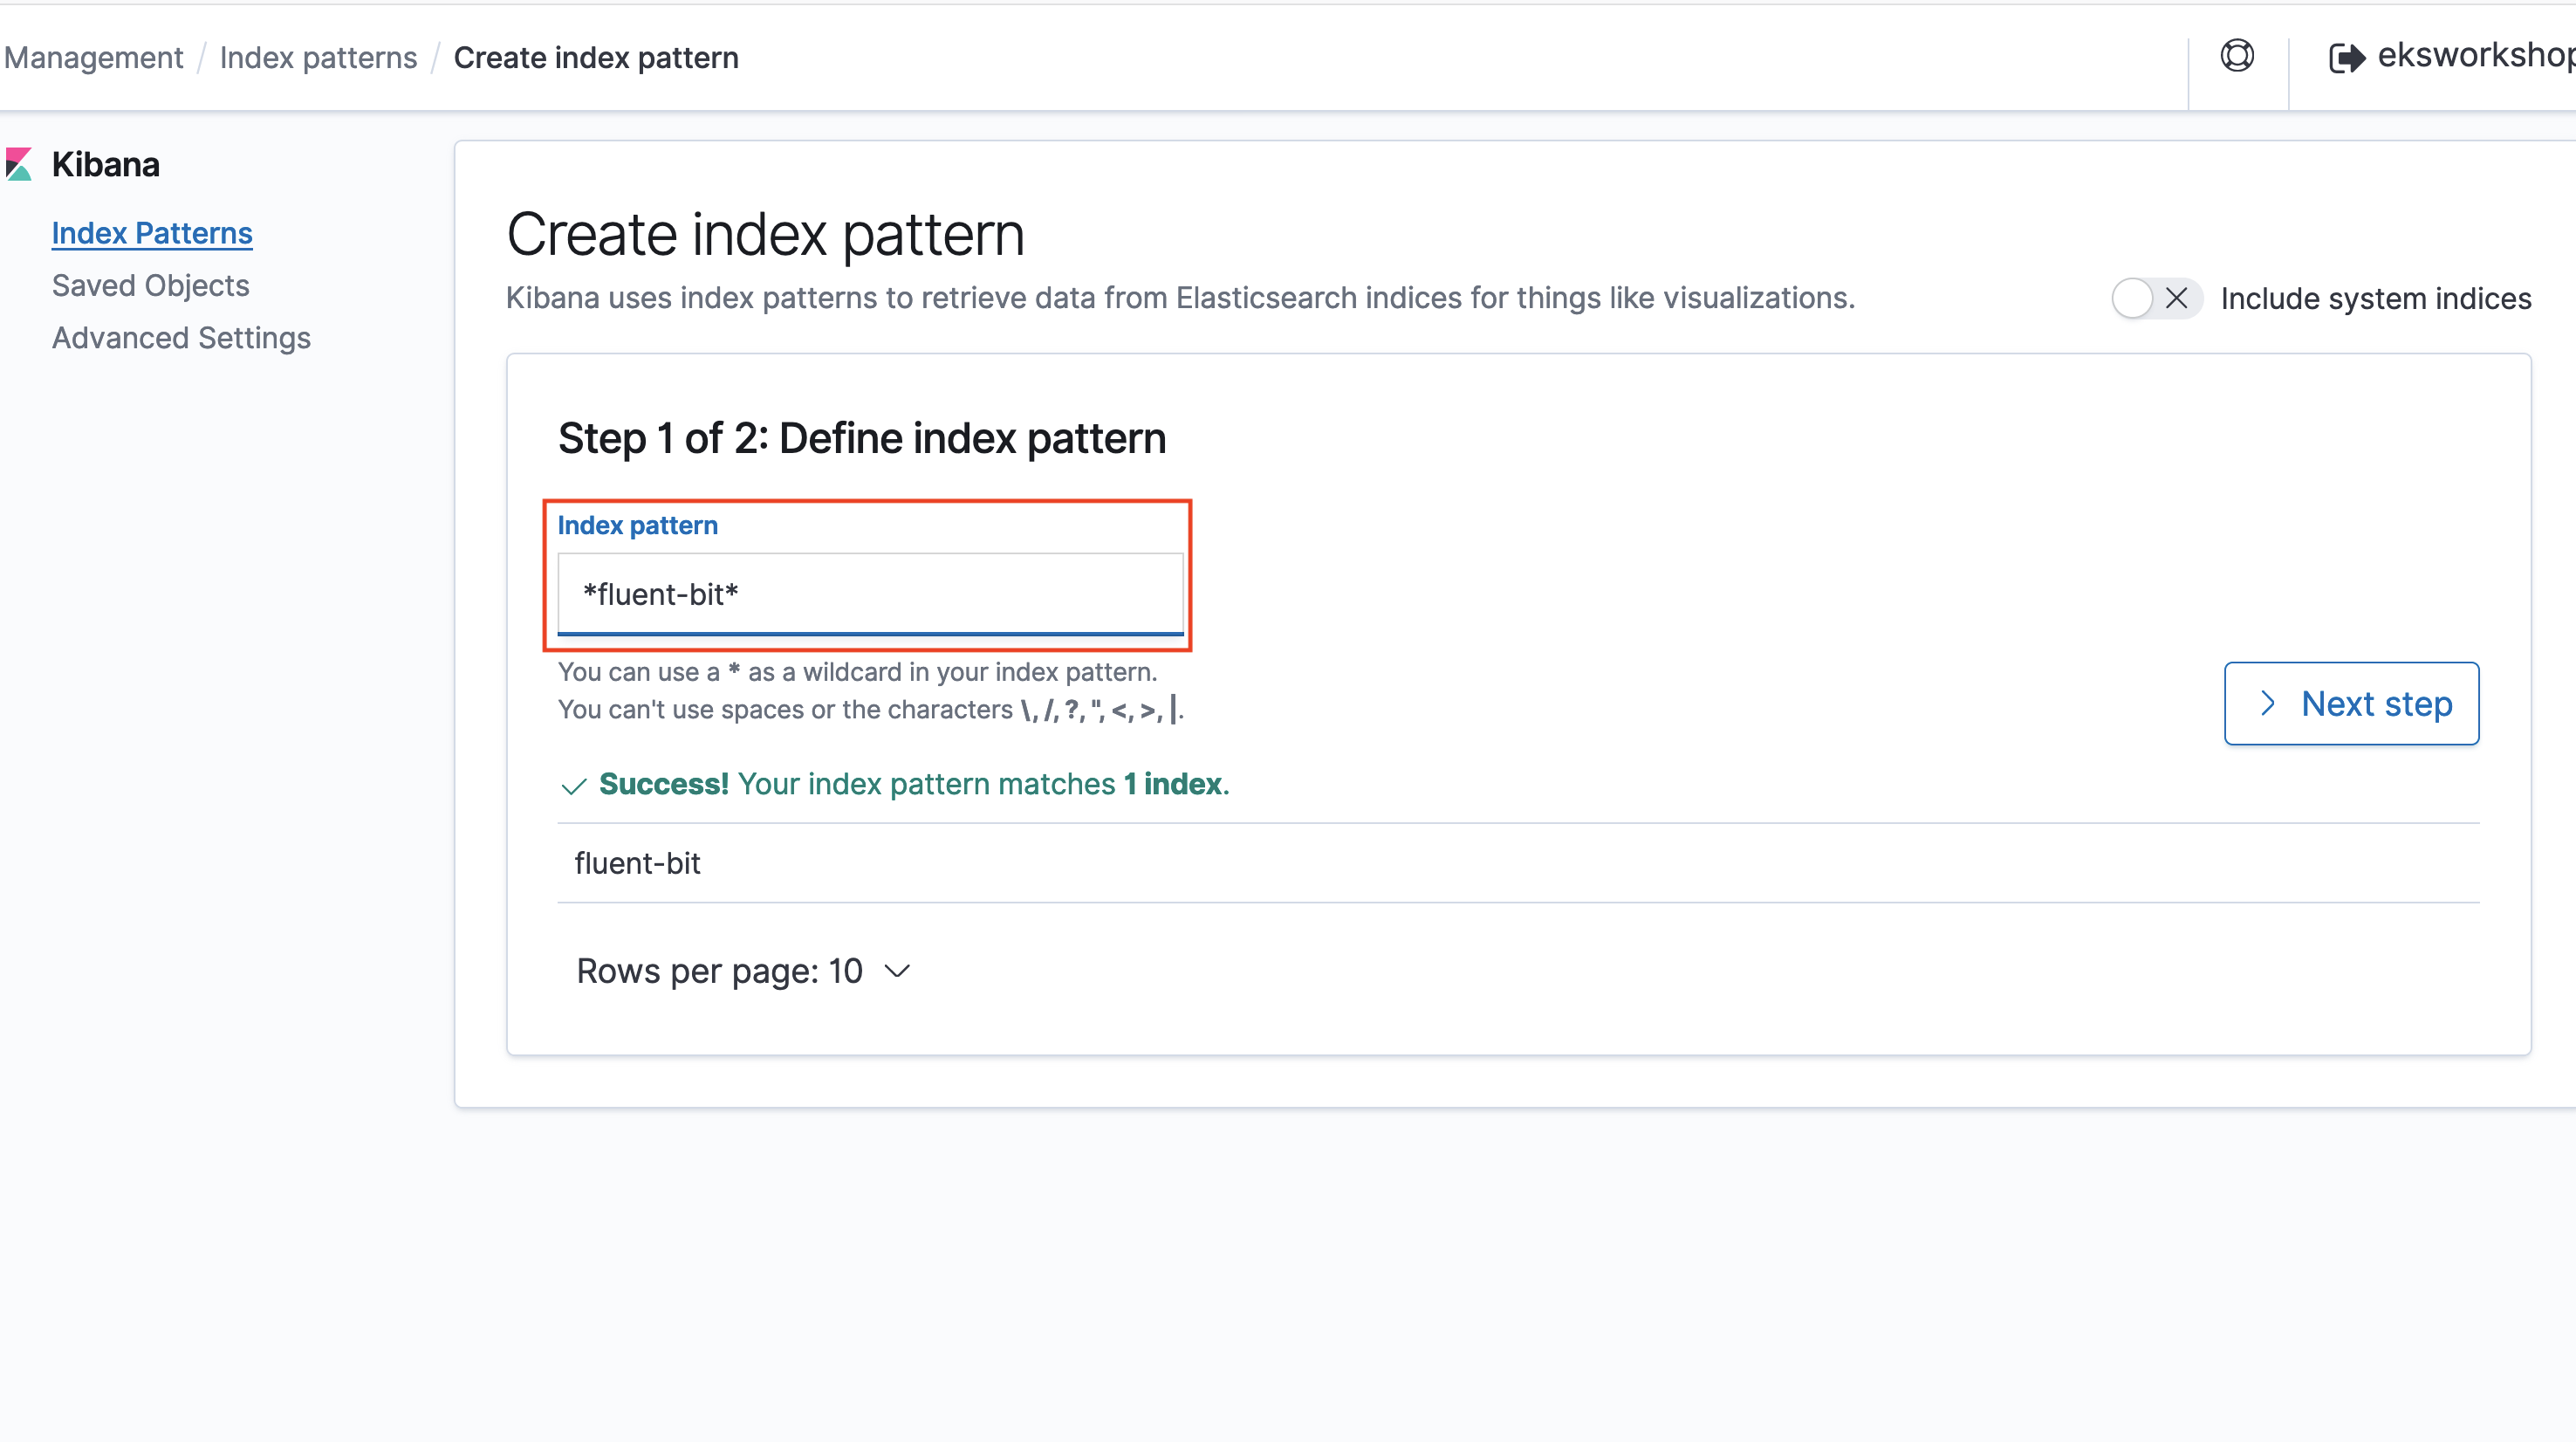
Add *fluent-bit* as the Index pattern and click Next step
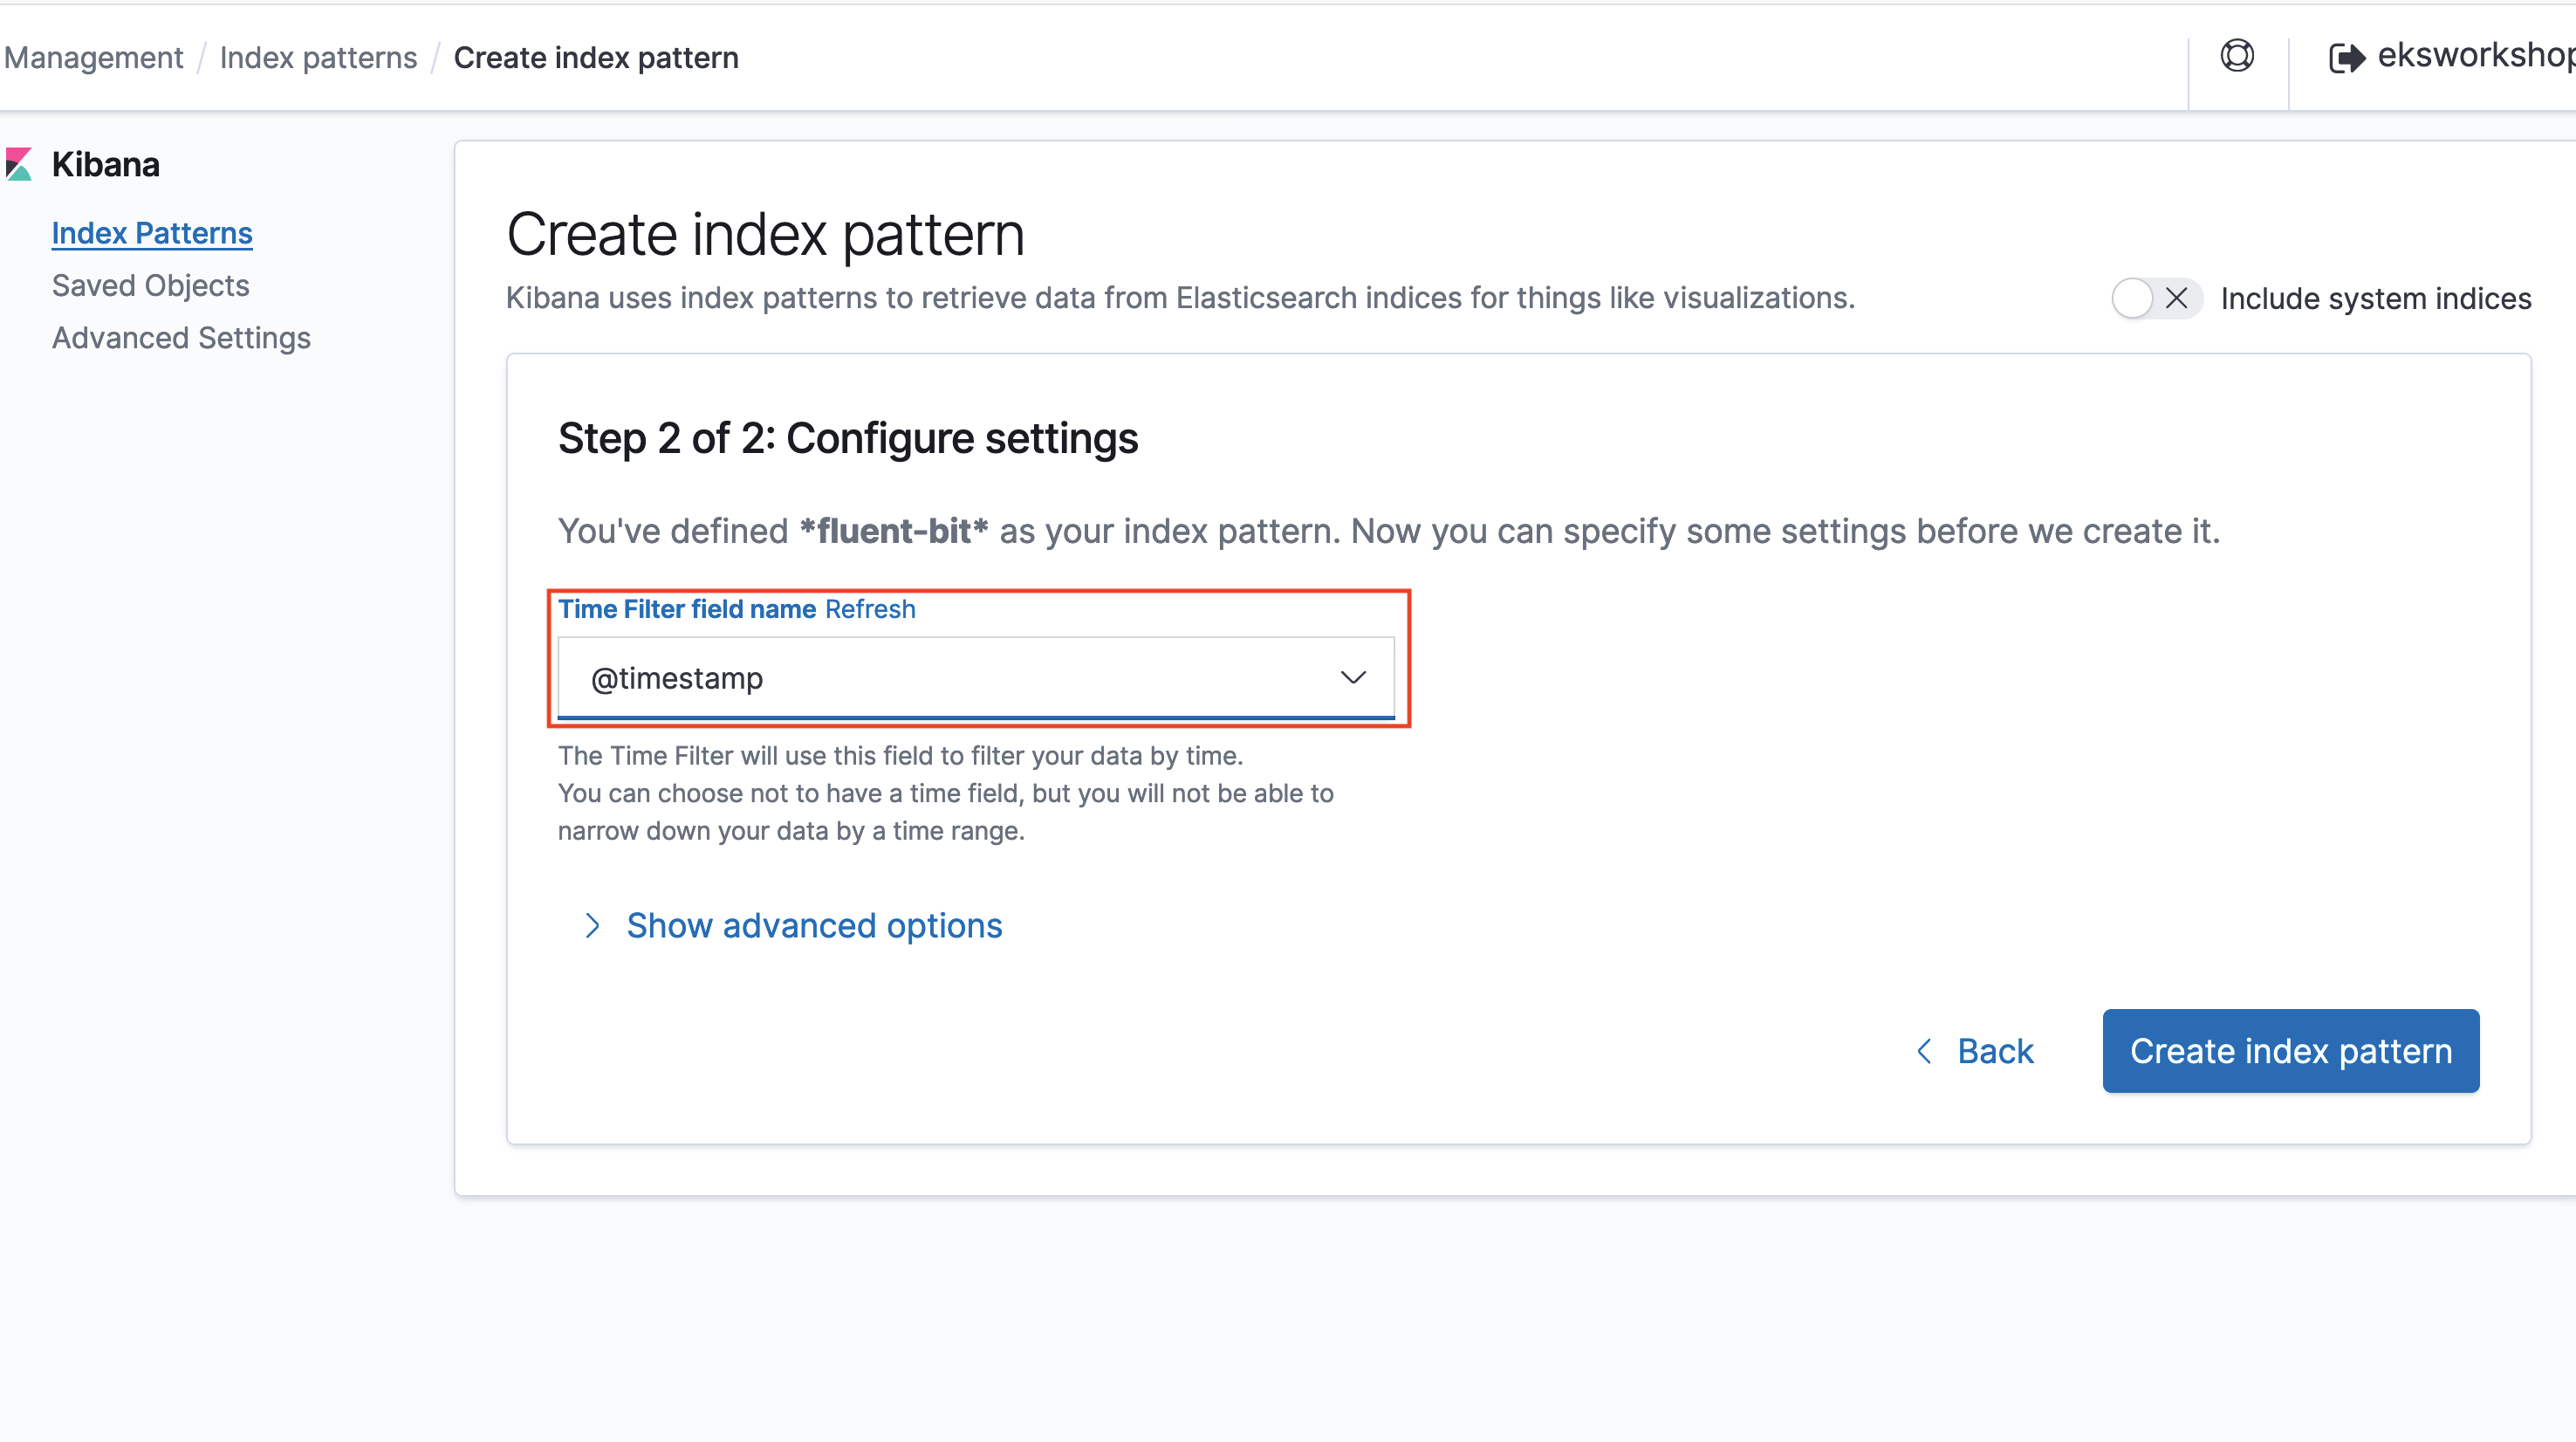
Select @timestamp as the Time filter field name and close the Configuration window by clicking on Create index pattern
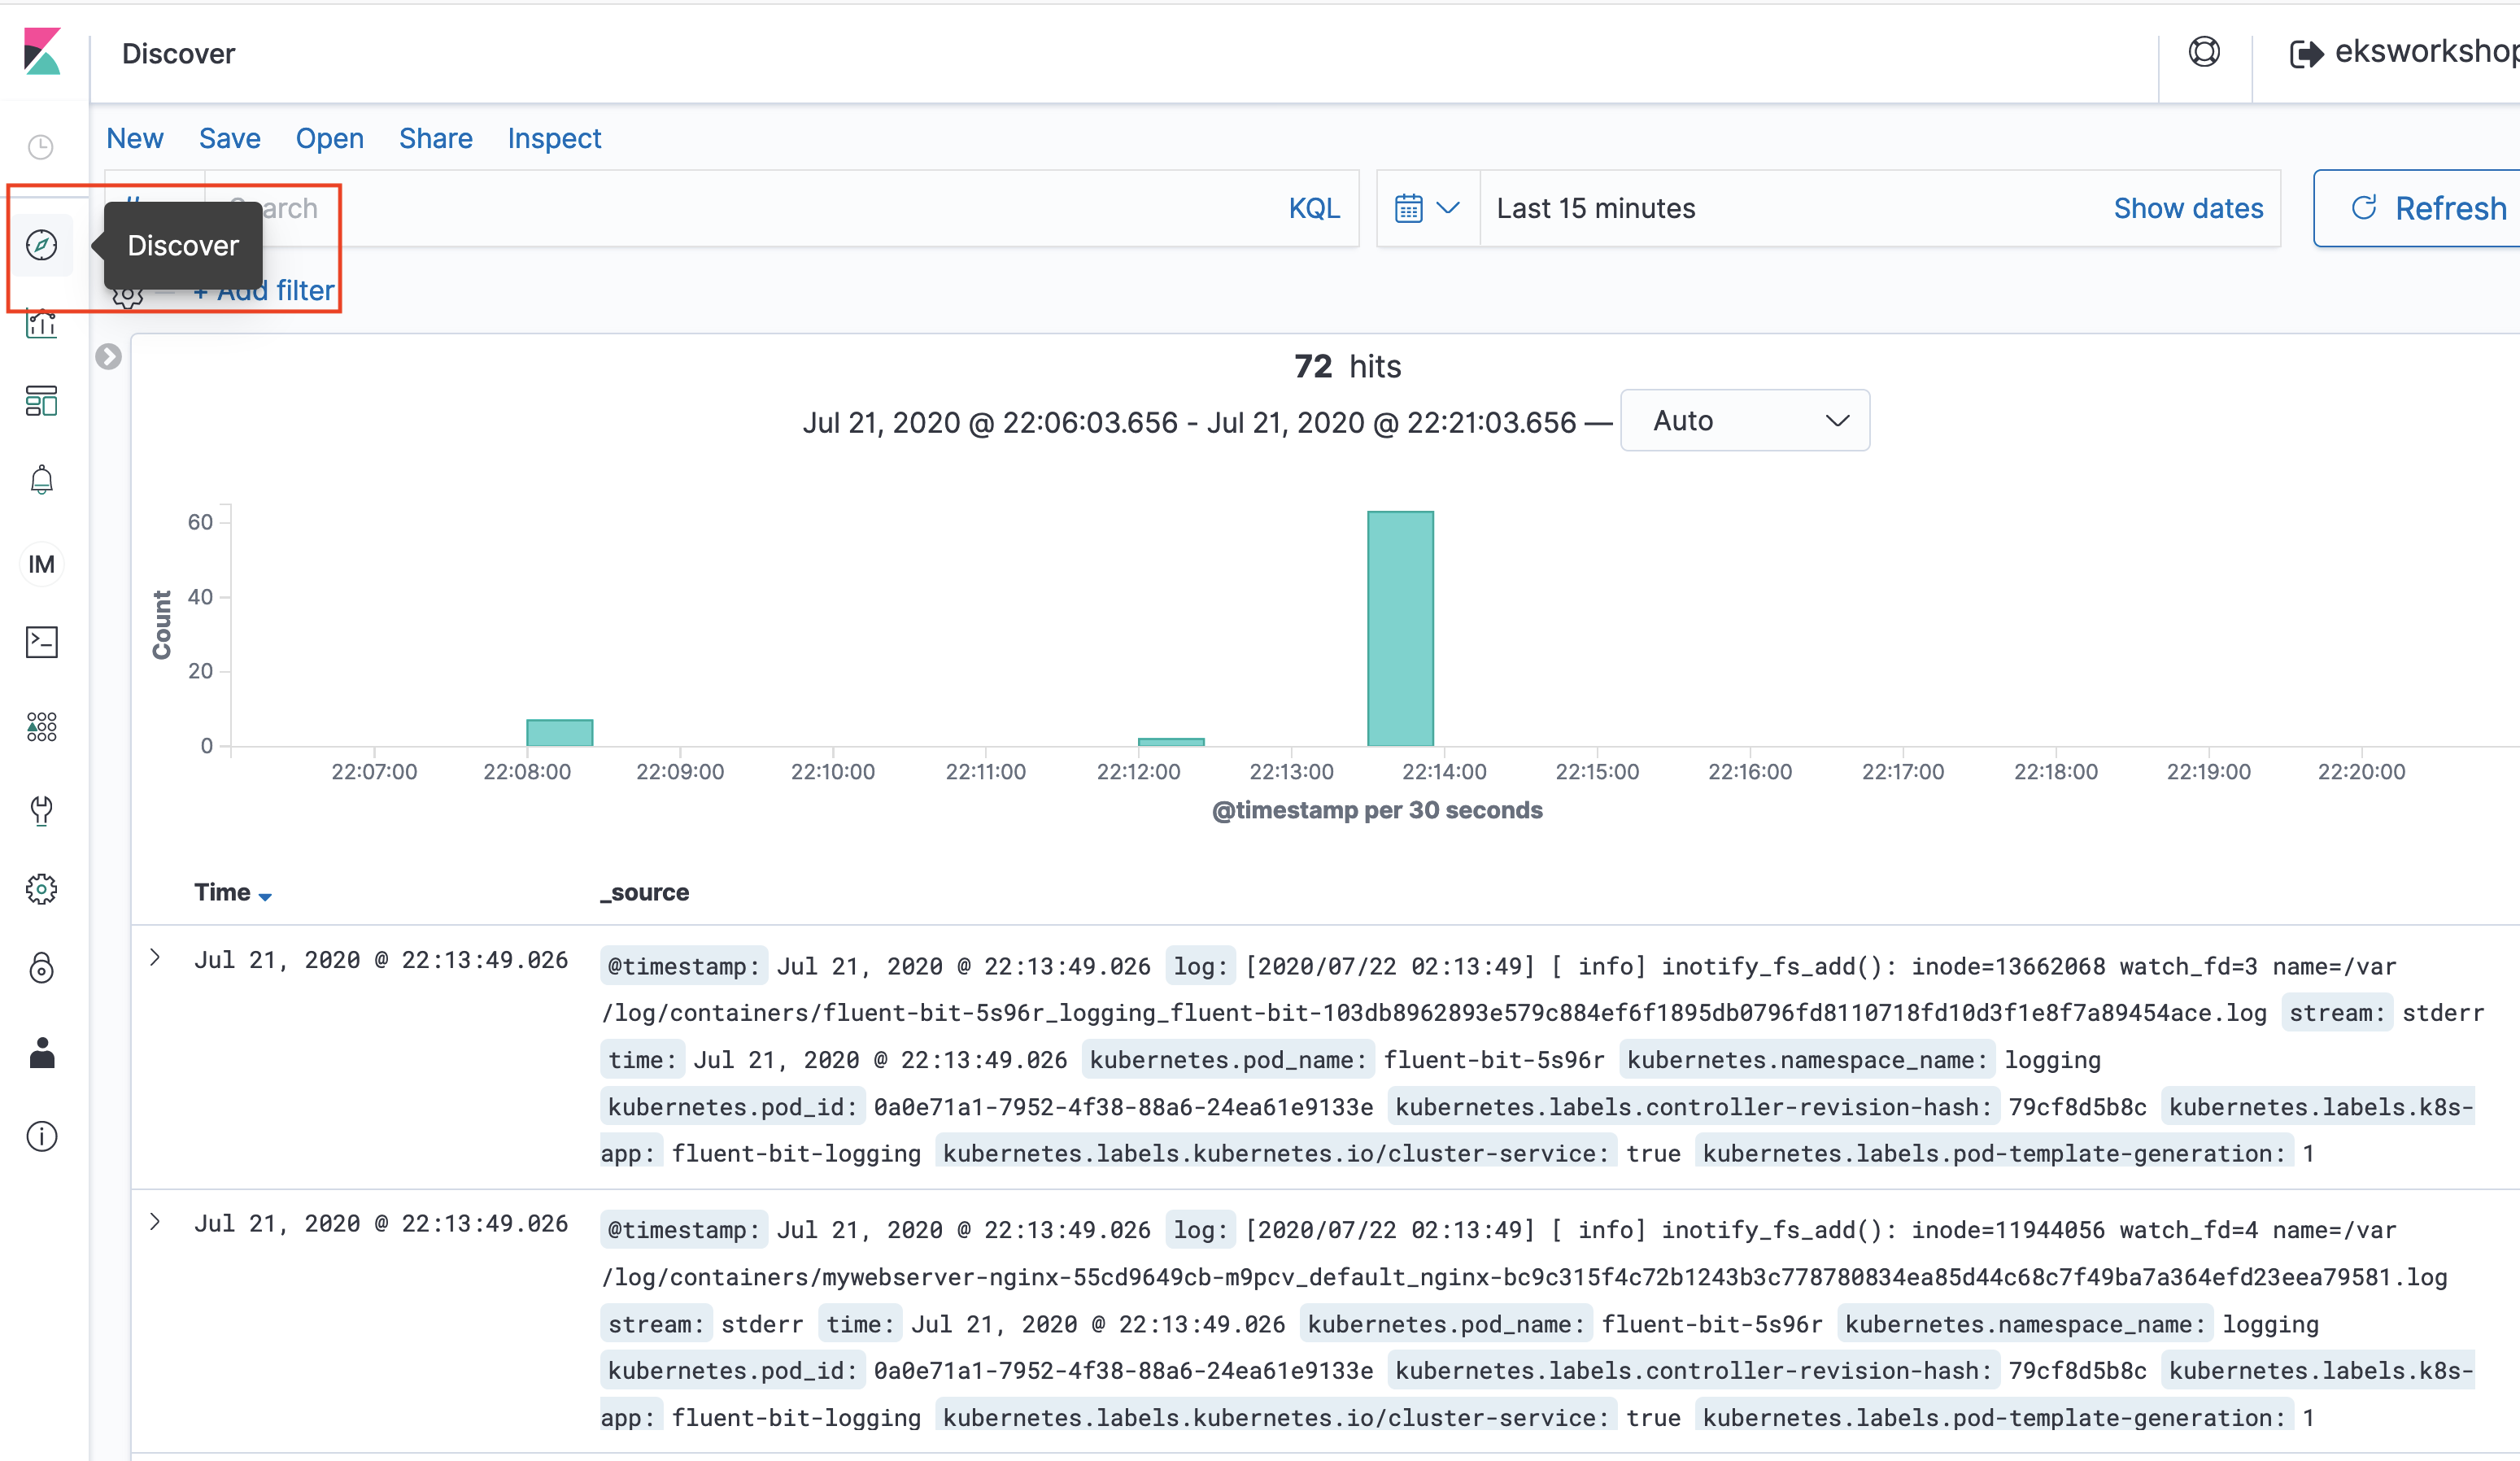
Finally you can select Discover from the left panel and start exploring the logs